
The post has been translated automatically. Original language: Russian





Almost every report has a row with an average value. Average response time, average receipt, average task completion time. This is a convenient number: it is one and it is easy to compare it with the previous month. But it is precisely because of its simplicity that it often does not answer the question that was asked.
The average describes the data well only when the values are located tightly around the center. This rarely happens in real processes. There is usually a large group of regular cases and a small group of very long ones. Ten fast values and one very slow value give an average that was not present in any individual case.
Therefore, it is worth looking at the median along with the average. The median is the value that divides the sample into two equal halves. If the average is noticeably higher than the median, then there is a long tail in the data, and this is the most interesting thing.
Then the percentiles help. The ninetieth percentile indicates a value that is not exceeded in ninety percent of cases. He answers the question that people usually want to ask: what does the experience of the part of users who had to wait longer than the rest look like. It is often these cases that shape the attitude towards the product.
It is useful to plot the entire distribution once, not just the summary figures. The distribution graph immediately shows how many groups there are in these groups. If two vertices are visible, this is a sign that two different processes have entered the same table, and it is more correct to count them separately.
And one last thing. When comparing the averages between the periods, check the sample composition. If the data structure has changed, for example, a new city or a new type of order has been added, then the change in the average indicates the composition, not the quality of the process.
A simple rule for the report: always put the number of observations, the median, and one percentile next to the average. Three digits instead of one take up the same amount of space, but they describe the process honestly.
Are percentiles counted regularly in your reports, or only when analyzing specific cases?
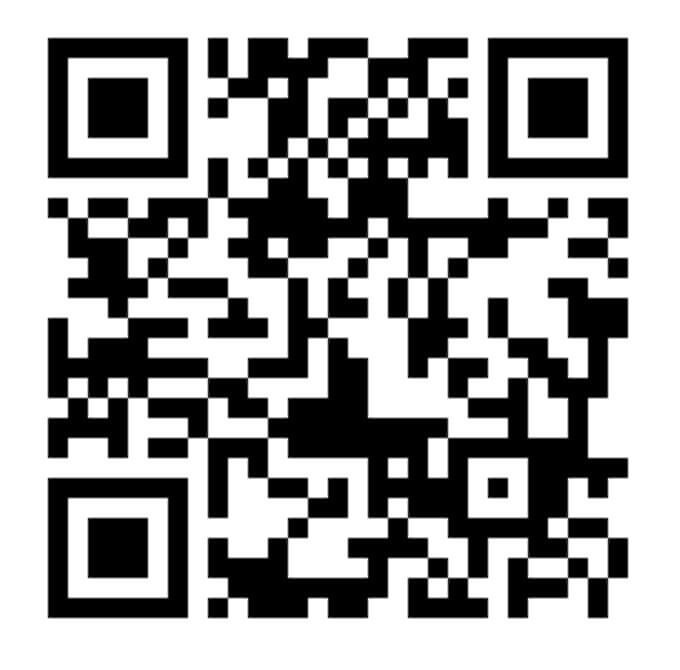
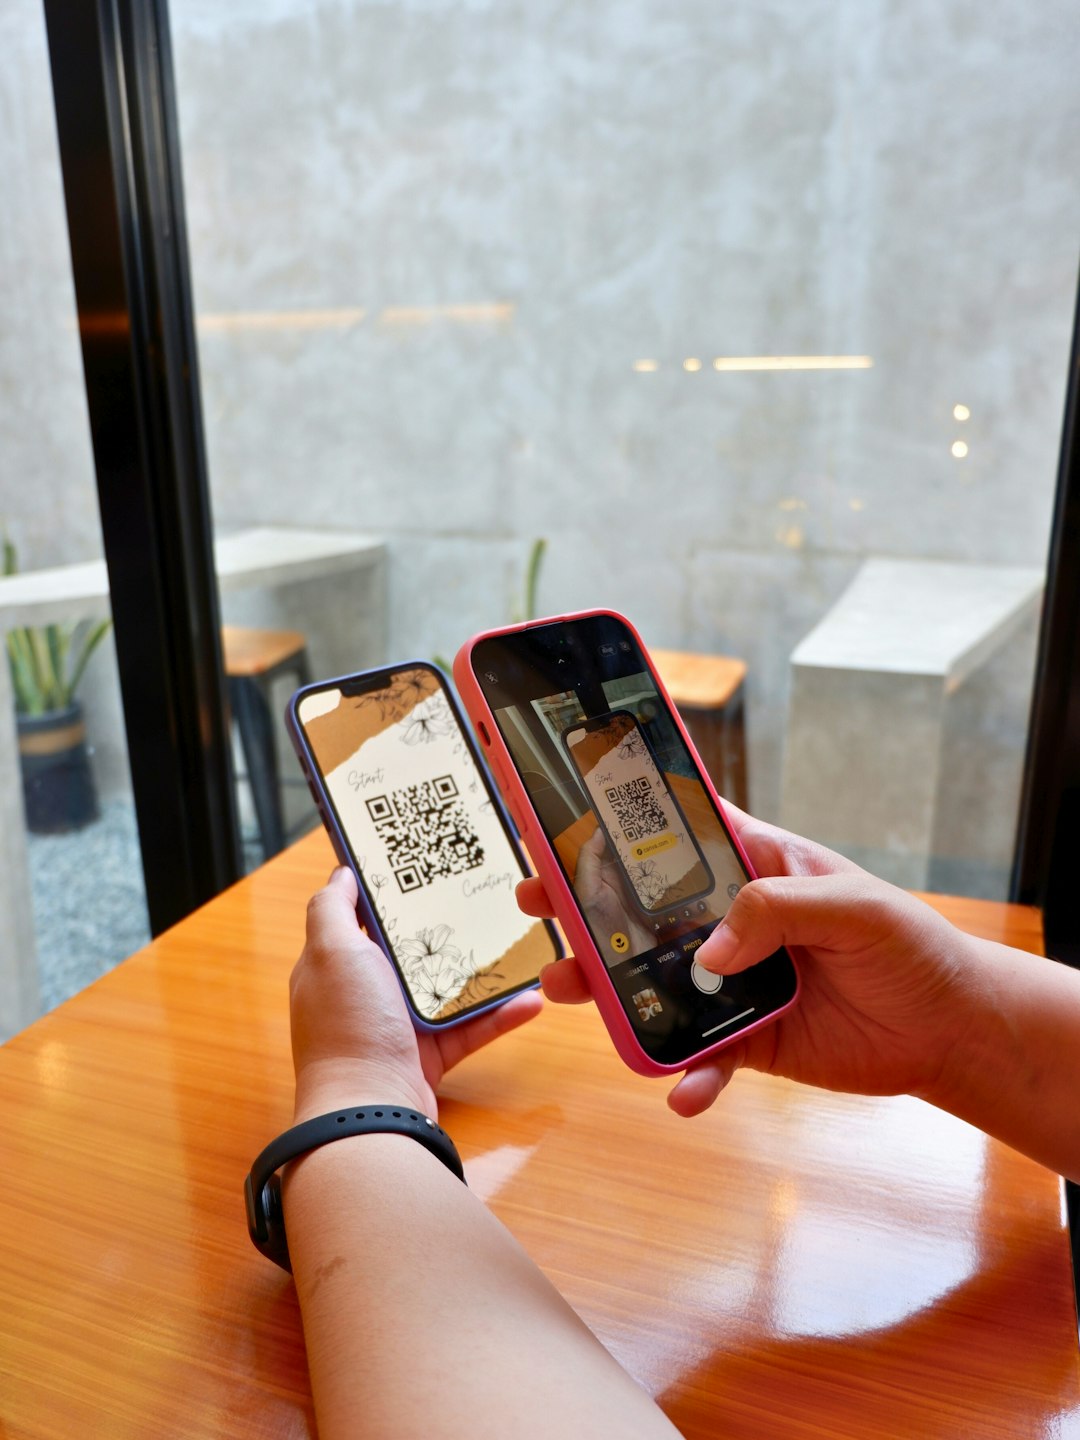
QR код это картинка, в которой текст записан чёрными и белыми квадратиками. Каждый квадратик это один бит информации. Камера видит сетку, переводит её в набор нулей и единиц, а дальше по правилам кодирования собирает из них обычную строку. Чаще всего внутри лежит ссылка, но так же спокойно записывается номер счёта, текст или настройки для подключения к сети.
Три больших квадрата по углам нужны для ориентации. По ним телефон понимает, где верх, где низ и под каким углом лежит код. Именно поэтому картинку можно снимать сбоку или перевёрнутой, и она всё равно прочитается. Четвёртый угол оставили пустым специально, чтобы положение кода определялось однозначно.
Самое интересное это устойчивость к повреждениям. При создании кода к данным добавляется избыточность, дополнительные квадратики, которые позволяют восстановить потерянную часть. В зависимости от выбранного уровня можно потерять от семи до тридцати процентов картинки, и код всё равно прочитается. Поэтому в центр спокойно ставят логотип, а сам код продолжает работать даже поцарапанным или частично закрытым.
Размер тоже не случайный. Чем больше данных внутри, тем плотнее сетка и тем мельче квадратики. Длинная ссылка превращается в очень частый рисунок, который камера уже с трудом различает. Поэтому в код обычно кладут короткую ссылку, а не полный адрес со всеми параметрами.
А вы часто платите или регистрируетесь через QR код?

 Share