
The post has been translated automatically. Original language: Russian




In the comments to a previous post about menu engineering, Nikolai Gorozhanin asked a precise question: if the "margin/popularity/stability of demand" matrix shows which positions to keep on the menu, then how to calculate in practice how many portions to cook for tomorrow? I'm reviewing the methodology.
Why is the forecast based on category, not position?
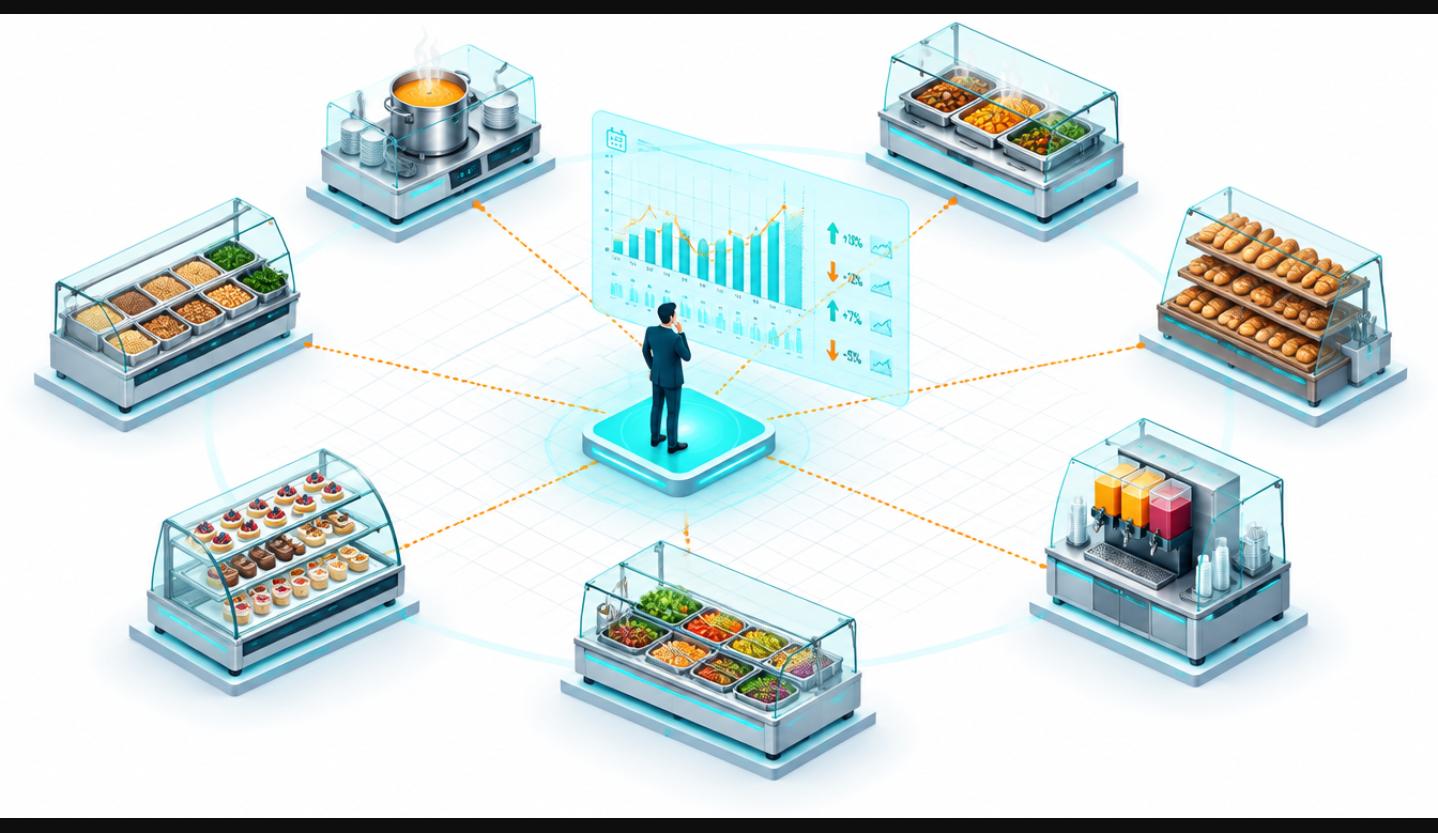
The first mistake that almost everyone makes when trying to predict a production plan is trying to predict the sales of each individual position. This is a disastrous path: the narrower the slice, the higher the random spread and the lower the accuracy. "The guest"does not choose "pilaf" — he chooses "hot meat", and within the category, a specific dish is often determined by what is next to it on the distribution on that day. Forecast at the category level (7 categories from the last post: soups, hot meat/fish, side dishes, salads and snacks, pastries and bread, drinks, desserts) smooths out this noise and gives working accuracy. The distribution within a category by position is a separate, much more rough estimate based on the sales history of specific dishes.
Method: moving average by day of the week + correction
The base is not the average for the entire period, but the average for each day of the week separately for the last 8 weeks. Monday counts as Mondays, Friday counts as Fridays: the self—service canteen has a weekly seasonality stronger than random noise, and if it is not divided, the forecast will either be overestimated or underestimated depending on the day.
Three corrections are added to the base average for the day of the week:
The trend is an increase or decrease in the flow over the past 2-3 weeks (a new tenant in a business center, the holiday season, the closure of a neighboring competitor's facility).
Calendar events include holidays, paydays in B2B contract client companies, and weather anomalies for categories like "soups" (the demand for soup is noticeably higher in the cold).
One—time factors are maintenance in a business center, a corporate event with a change in the flow of guests.
Three sources of forecast error
An example in numbers: "Loaf"
With a flow of ~400 servings/day and an average receipt of 1,200 ₸, a forecast at the category level (not a position) with an accumulated history of 8 weeks or more gives an average accuracy of 85-90% for the day ahead. This means that if the model says "60 servings of soup tomorrow," the facts will most often be in the range of 51-69 servings. Categories with high stability in demand (side dishes, bread) keep the accuracy closer to 90-95%; categories with pronounced seasonality or weather dependence (soups, individual hot dishes) — closer to 75-80%.
How does the forecast affect production
The forecast itself is not a solution — it is an entry into the cooking rule that I mentioned in the comments: positions with stable demand are prepared 100% under the forecast; positions with a spread of more than a third of the average volume are prepared with the base volume (70% of the forecast) with an addition after the flow during the day of distribution (the remaining 30%). This rule directly reduces write-offs without loss in lost sales.incorrect output
Portion forecasting is not a separate AI project or excel with formulas for the sake of formulas, but a working tool only when it is built into a specific solution: how much to cook now, and how much — after the flow. Without this bundle, any forecast figure, even the exact one, remains just a figure on the screen.
How is the production for tomorrow calculated in your dining room now — based on yesterday's sales, on the cook's intuition, or is there already a model?
В комментариях к прошлому посту про меню-инжиниринг Николай Горожанин задал точный вопрос: если матрица «маржа/популярность/стабильность спроса» показывает, какие позиции держать в меню, — то как на практике считать, сколько порций готовить на завтра? Разбираю методику.
Почему прогноз — по категории, а не по позиции
Первая ошибка, которую делают почти все, кто пробует прогнозировать production plan, — пытаются предсказать продажи каждой отдельной позиции. Это провальный путь: чем уже срез, тем выше случайный разброс и ниже точность. Гость выбирает не «плов» — он выбирает «горячее мясное», а внутри категории конкретное блюдо часто определяется тем, что стоит рядом на раздаче в этот день. Прогноз на уровне категории (7 категорий из прошлого поста: супы, горячее мясо/рыба, гарниры, салаты и закуски, выпечка и хлеб, напитки, десерты) сглаживает этот шум и даёт рабочую точность. Распределение внутри категории по позициям — это уже отдельная, гораздо более грубая прикидка на основе истории продаж конкретных блюд.
Метод: скользящее среднее по дню недели + поправка
База — не среднее по всему периоду, а среднее по каждому дню недели отдельно за последние 8 недель. Понедельник считается по понедельникам, пятница — по пятницам: у столовой self-service недельная сезонность сильнее случайного шума, и если её не разделить, прогноз будет либо завышен, либо занижен в зависимости от дня.
К базовому среднему по дню недели добавляются три поправки:
Тренд — рост или падение потока за последние 2–3 недели (новый арендатор в БЦ, сезон отпусков, закрытие соседнего объекта конкурента).
Календарные события — предпраздничные дни, дни зарплаты в компаниях-клиентах B2B-контракта, погодные аномалии для категорий вроде «супы» (в холод спрос на суп ощутимо выше).
Разовые факторы — техническое обслуживание в БЦ, корпоративное мероприятие с изменением потока гостей.
Три источника ошибки прогноза
Пример на цифрах: «Каравай»
При потоке ~400 порций/день и среднем чеке 1 200 ₸ прогноз на уровне категории (не позиции) при накопленной истории от 8 недель в среднем даёт точность 85–90% на день вперёд. Это означает: если модель говорит «завтра 60 порций супа», фактика чаще всего окажется в диапазоне 51–69 порций. Категории с высокой стабильностью спроса (гарниры, хлеб) держат точность ближе к 90–95%; категории с выраженной сезонностью или погодной зависимостью (супы, отдельные горячие блюда) — ближе к 75–80%.
Как прогноз ложится на производство
Прогноз сам по себе не решение — это вход в правило приготовления, которое я упоминал в комментариях: позиции со стабильным спросом готовятся на 100% под прогноз; позиции с разбросом больше трети от среднего объёма — готовятся базовым объёмом (70% от прогноза) с добавкой по факту потока в течение дня раздачи (оставшиеся 30%). Это правило напрямую снижает списания без потери в упущенных продажах.лавный вывод
Прогноз порций — это не отдельный ИИ-проект и не excel с формулами ради формул, а рабочий инструмент только тогда, когда он встроен в конкретное решение: сколько готовить сейчас, а сколько — по факту потока. Без этой связки любая, даже точная, цифра прогноза остаётся просто цифрой на экране.
Как у вас в столовой сейчас считают производство на завтра — по вчерашним продажам, по интуиции повара, или уже есть модель?
 Share