

The post has been translated automatically. Original language: Russian





Sellers on Kaspi usually rate ads in one figure: the cost per click per month divided by the number of orders. The figure turns out to be beautiful, and that's why budget decisions are made incorrectly. Let's look at why this happens and how to calculate it honestly.
Four taps from one pipe
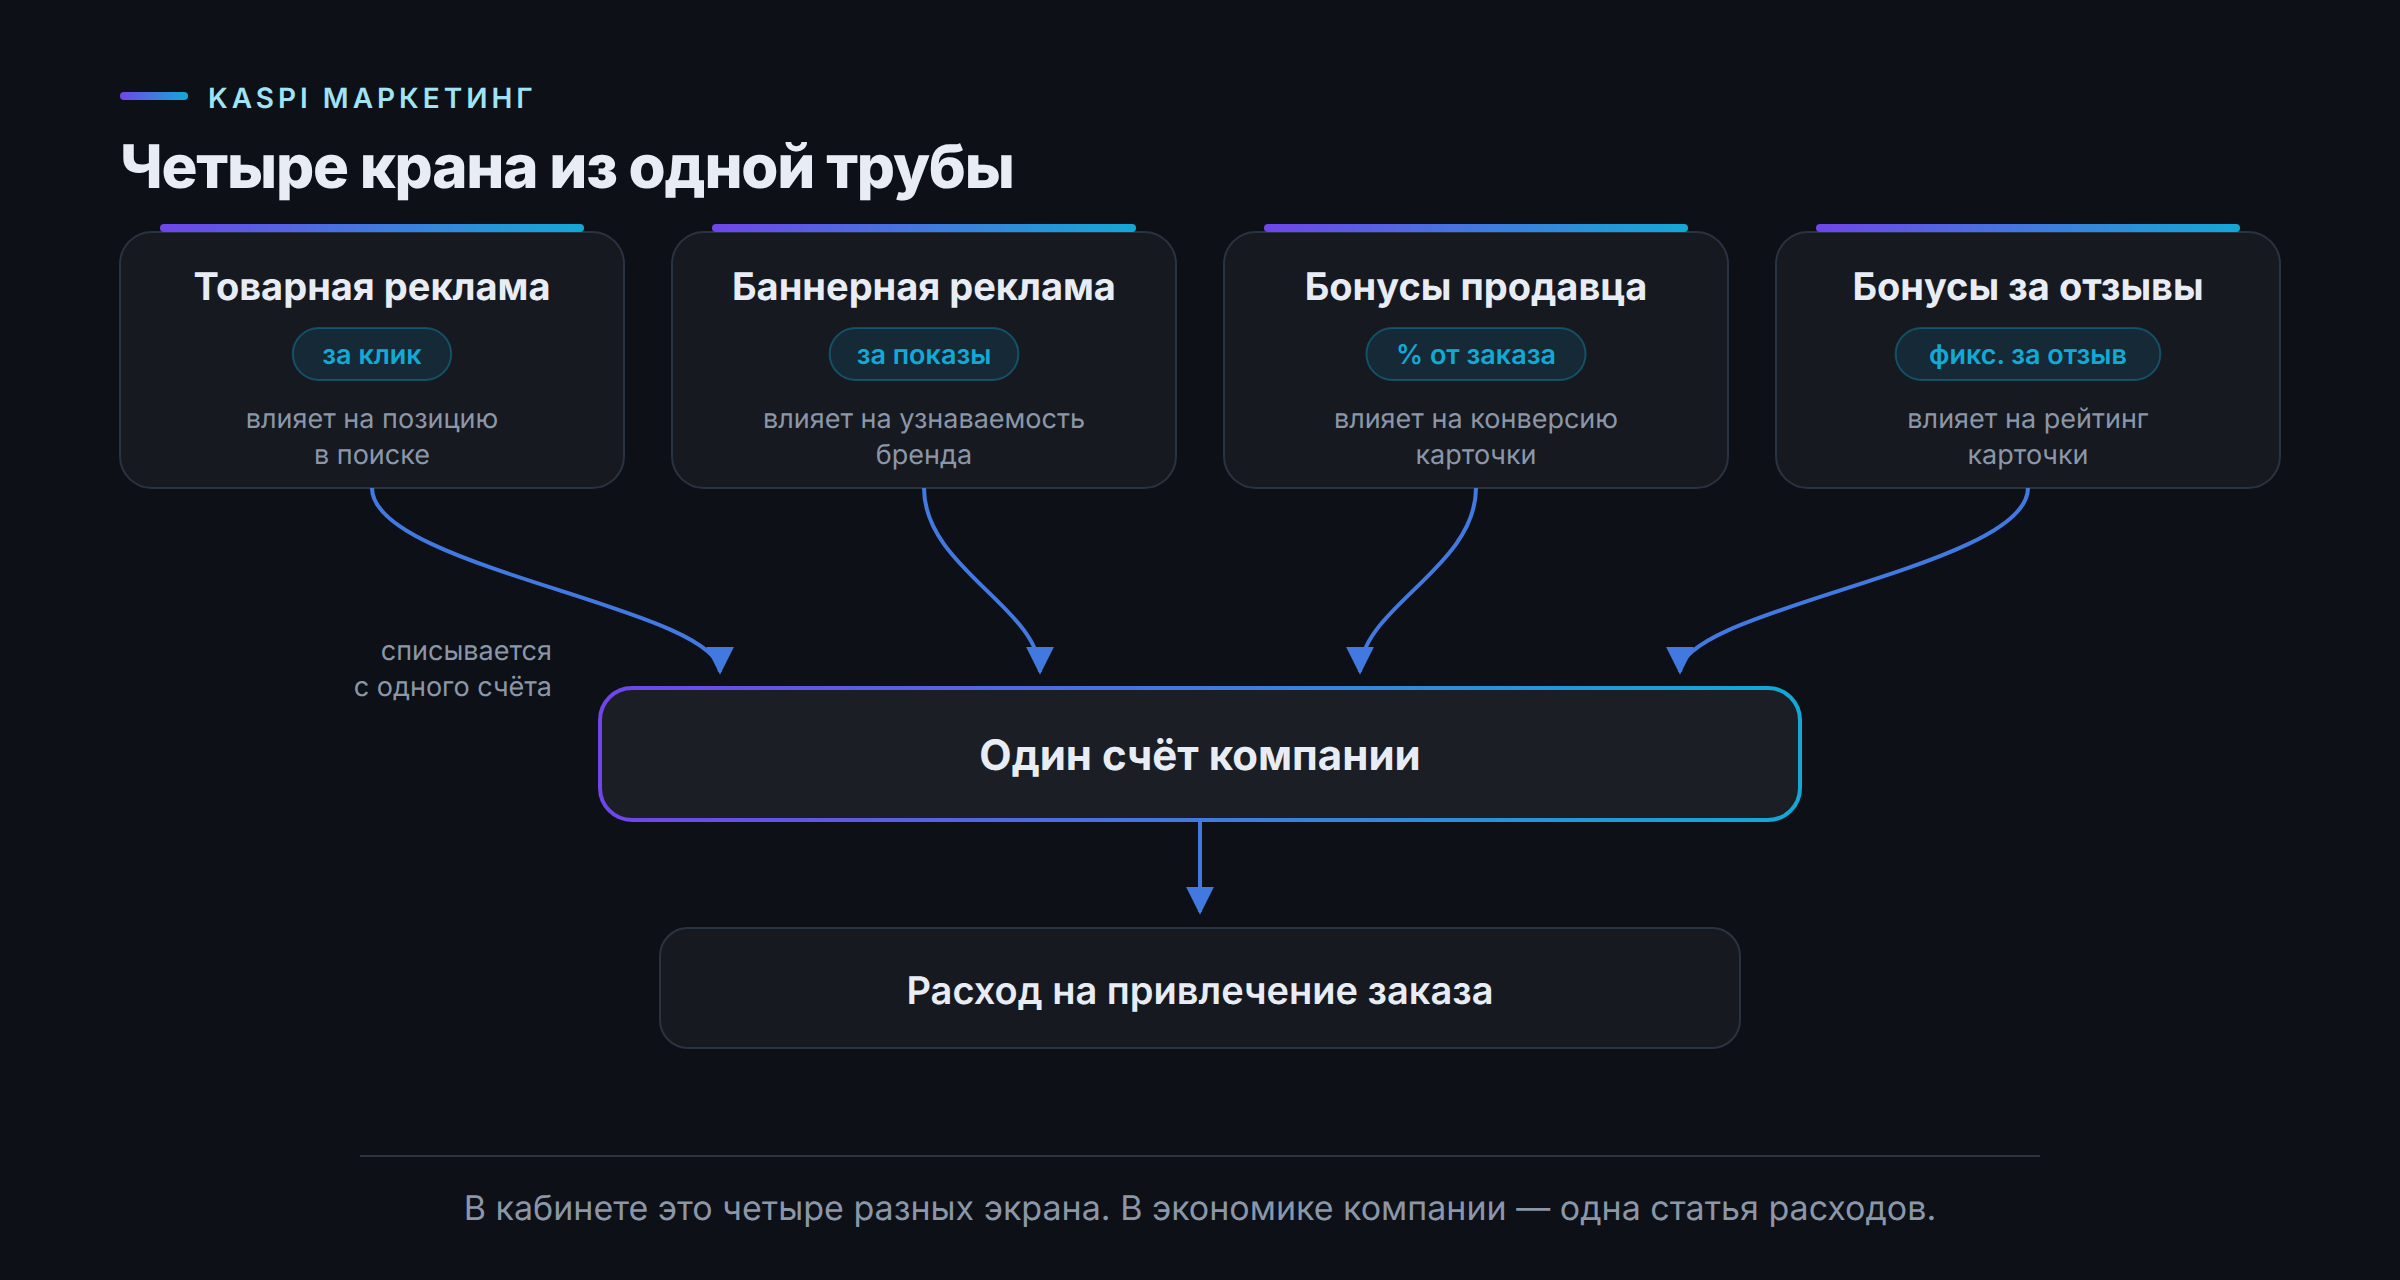
There are four paid tools in Kaspi Marketing, and all of them are debited from one company account.:
- Product advertising is a pay—per-click approach that affects your position in search, categories, and recommendation blocks.
- Banner advertising of a brand is a payment for impressions, it works for recognition.
- Bonuses from the seller — a percentage of the order, affects the conversion of the card.
- Bonuses for reviews — a fixed amount per review, affects the rating.
There are four different screens in the office. In the company's economy, it is one item of expenditure for attracting an order.
Why can't these tools be counted separately?
The rating of the card participates in the ranking along with the bet. With the same bid, a high-rated card gets a higher position, which means that a weak card pays more for the same position. It turns out to be a cycle: bonuses for reviews raise the rating → CTR and conversion grow → lower bid → cheaper click → more orders with the same budget. And the reverse cycle: negative without response → the conversion rate drops → to hold the position, we raise the bid → the click is more expensive.
Advertising and reputation in the cabinet are in different tabs, but they stand side by side in the order cost formula.
The formula for the total cost of an order from an advertisement
(cost of clicks + seller bonuses + cost of bonuses for reviews) / number of orders received from advertising
Two typical calculation errors:
- The numerator only counts clicks. Bonuses are processed according to other reports and are not included in the order price.
- The denominator includes all the store's orders, including organic ones. Advertising "gets" the merits of organics.
But there is a third mistake, and it lives in the denominator itself.
The advertising turnover is calculated based on completed orders, not purchased ones.
Kaspi counts the order into the advertising turnover at the time of registration. Whether the customer canceled it after an hour, did not redeem it upon delivery, or made a refund, the order remains in place in the advertising reports. There is no money in the cash register for it, but it is among the "orders from advertising".
What follows from this:
- The effectiveness of advertising in the report is overestimated by exactly the proportion of cancellations and non-purchases. In categories with long delivery, large inventory, or unstable balances, the discrepancy is noticeable.
- Cancellations are unevenly distributed. A product that has a problem with availability or deadlines generates a surge in completed and then canceled orders, and it looks like one of the most effective in the advertising report. According to the logic of "getting to where he works", the budget is often spent on him.
- The bids raised for such a product continue to cost money until someone manually checks the promotional orders against the actual shipments.
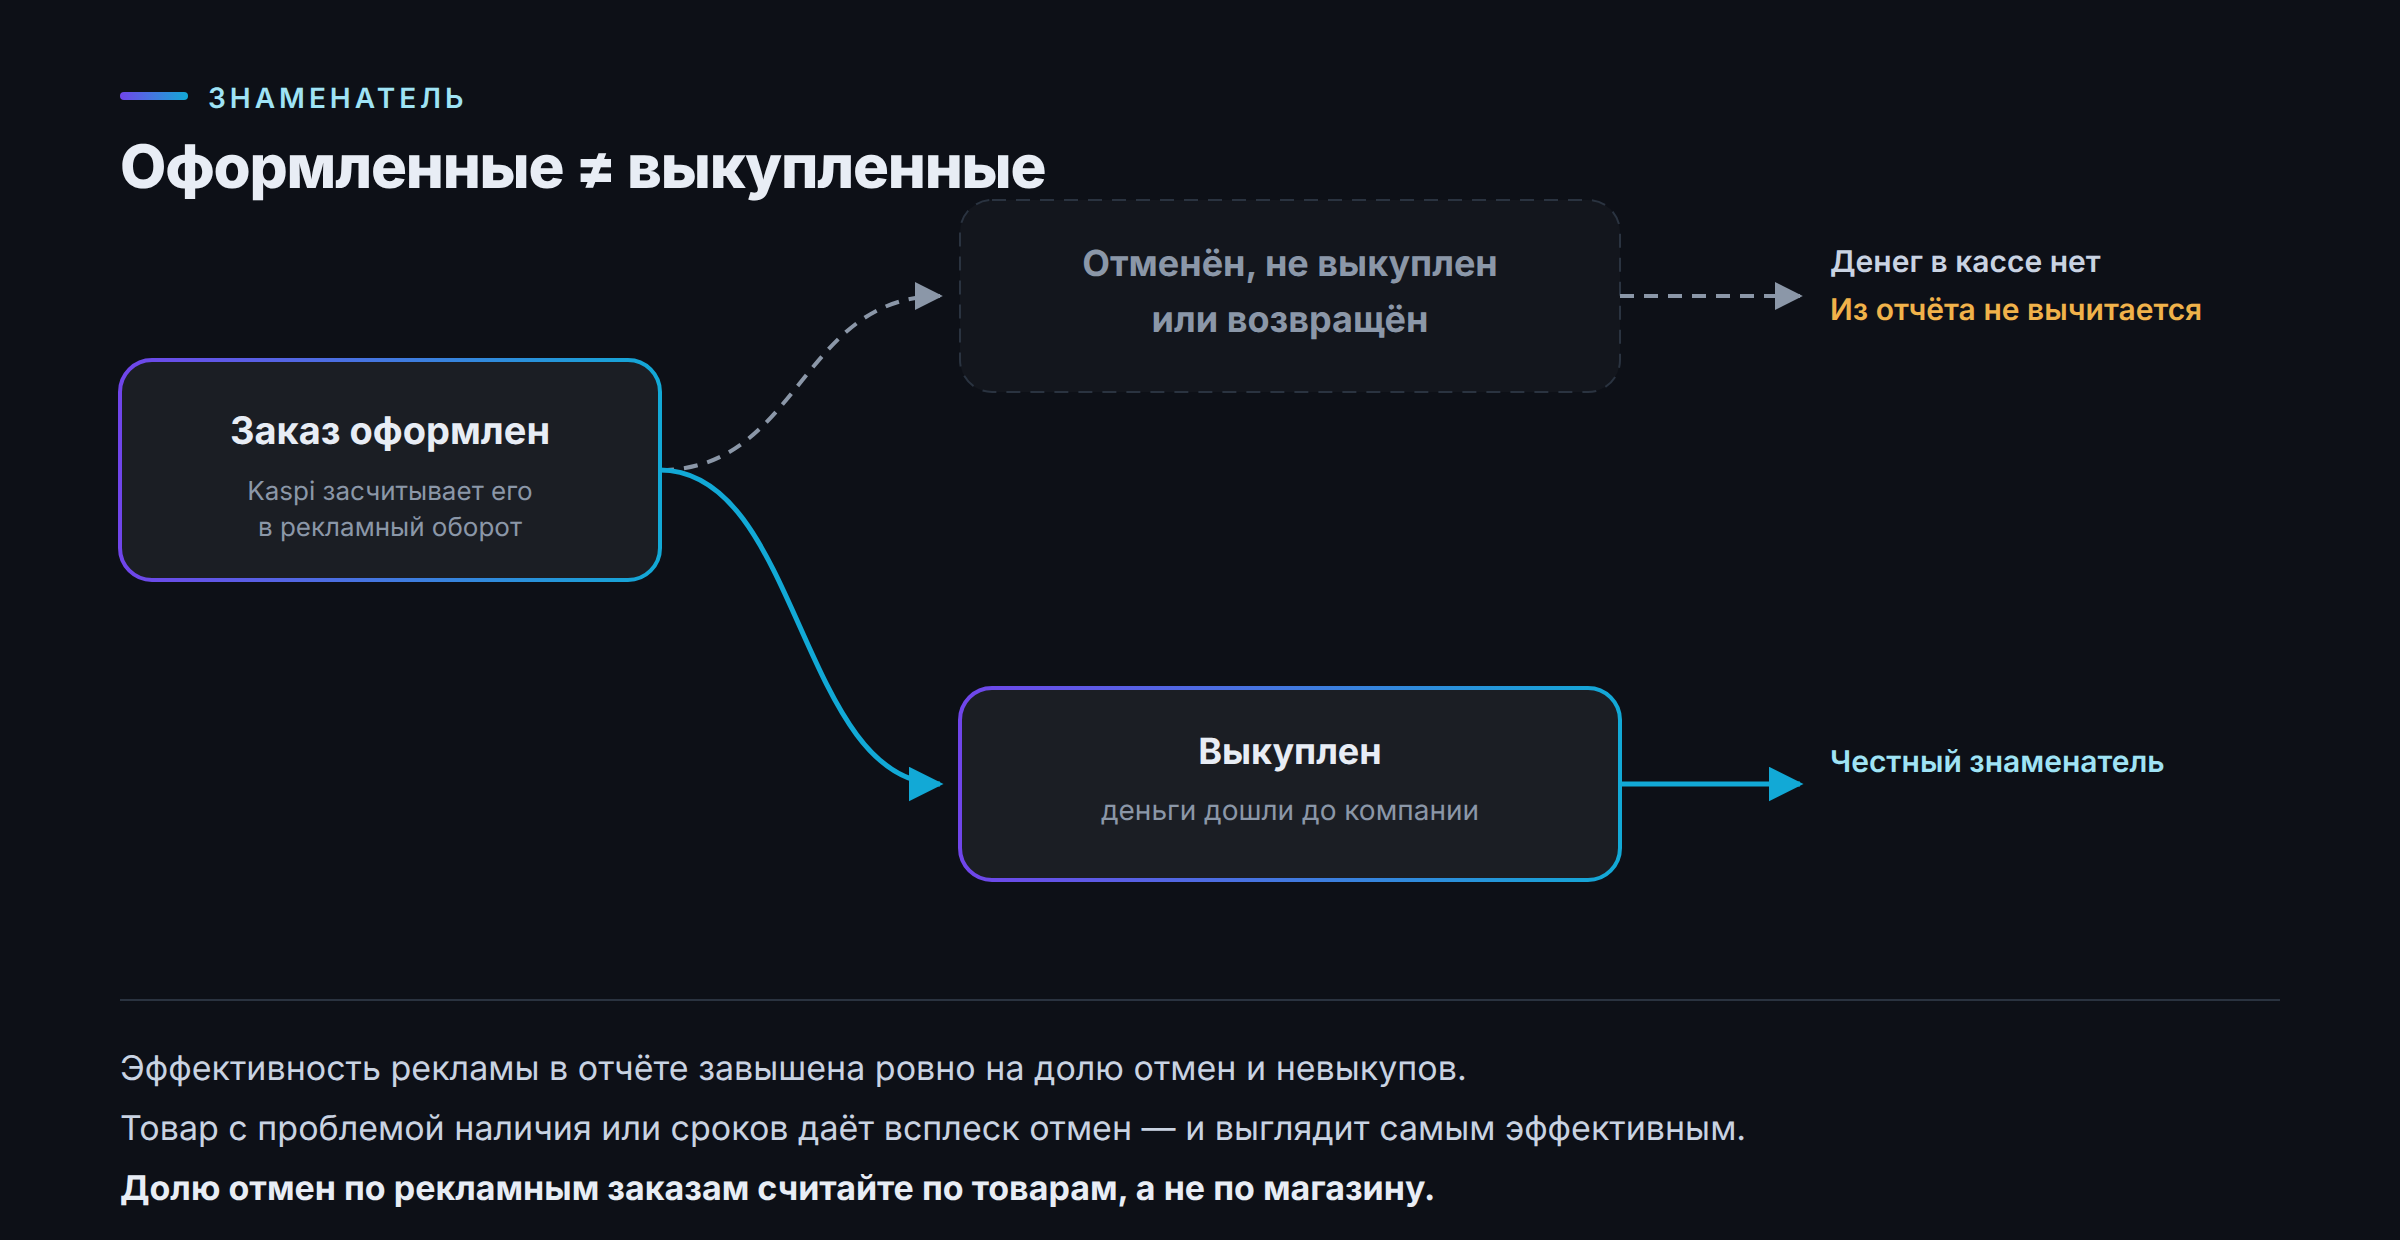
Therefore, the honest denominator is not the completed orders, but the purchased ones.:
(cost of clicks + seller bonuses + cost of bonuses for reviews) / redeemed orders received from ads
And it's worth keeping a separate record of cancellations for advertising orders — by product, not just by store. This is a cheap metric that quickly shows where advertising accelerates orders that do not reach the buyer.
In our experience, after recalculation using the full formula with purchased orders, the actual cost of the order turns out to be noticeably higher than that in the report, depending on the category, the share of bonuses and the share of cancellations. It is not the specific figure that is important, but the fact that no one saw it before the recalculation.
What to do next week
- Combine all four expenses into one weekly table, separately for each store.
- Divide orders into advertising and organic orders, at least for the products that participate in the advertisement.
- Compare promotional orders with actual shipments and calculate the percentage of cancellations and non-purchases for each product.
- Calculate the total cost of the order for the last month for the purchased orders.
- Fix it as a baseline. Without a baseline, there is nothing to compare any optimization with.
Where to go next
The daily report is also too large a unit: three days with the same expense may differ by half for orders, and the difference is hidden inside the day. The next step after the full formula is hourly cross—sections on rates, positions and expenses. The cabinet does not store such a history, you have to create it yourself: a snapshot of the status once an hour for each product, storage in a regular relational database, comparison by week. About this — in the next article.
Продавцы на Kaspi обычно оценивают рекламу одной цифрой: расход на клики за месяц, делённый на число заказов. Цифра получается красивой, и именно поэтому решения по бюджету принимаются неверно. Разбираем, почему так происходит и как посчитать честно.
Четыре крана из одной трубы
В Kaspi Маркетинге четыре платных инструмента, и все они списываются с одного счёта компании:
- Товарная реклама — оплата за клик, влияет на позицию в поиске, категории и рекомендательных блоках.
- Баннерная реклама бренда — оплата за показы, работает на узнаваемость.
- Бонусы от продавца — процент от заказа, влияет на конверсию карточки.
- Бонусы за отзывы — фиксированная сумма за отзыв, влияет на рейтинг.
В кабинете это четыре разных экрана. В экономике компании — одна статья расходов на привлечение заказа.
Почему эти инструменты нельзя считать отдельно
Рейтинг карточки участвует в ранжировании наравне со ставкой. При одинаковой ставке карточка с высоким рейтингом получает позицию выше, а значит за ту же позицию слабая карточка платит больше. Получается цикл: бонусы за отзывы поднимают рейтинг → растут CTR и конверсия → нужна меньшая ставка → клик дешевле → больше заказов при том же бюджете. И обратный цикл: негатив без ответа → падает конверсия → чтобы удержать позицию, поднимаем ставку → клик дороже.
Реклама и репутация в кабинете лежат в разных вкладках, но в формуле стоимости заказа они стоят рядом.
Формула полной стоимости заказа с рекламы
(расход на клики + бонусы продавца + расход на бонусы за отзывы) / число заказов, пришедших с рекламы
Две типичные ошибки при подсчёте:
- В числителе учитывают только клики. Бонусы проходят по другим отчётам и в стоимость заказа не попадают.
- В знаменателе берут все заказы магазина, включая органические. Реклама «получает» заслуги органики.
Но есть и третья ошибка, и она живёт в самом знаменателе.
Рекламный оборот считается по оформленным заказам, а не по выкупленным
Kaspi засчитывает в рекламный оборот заказ в момент оформления. Отменил ли его покупатель через час, не выкупил ли при доставке, оформил ли возврат — в отчётности по рекламе заказ остаётся на месте. В кассе денег по нему нет, а в числе «заказов с рекламы» он есть.
Что из этого следует:
- Эффективность рекламы в отчёте завышена ровно на долю отмен и невыкупов. В категориях с долгой доставкой, крупногабаритом или нестабильными остатками расхождение получается заметным.
- Отмены распределены неравномерно. Товар, у которого проблема с наличием или со сроками, генерирует всплеск оформленных и затем отменённых заказов — и в отчёте по рекламе выглядит одним из самых эффективных. Бюджет по логике «докинуть туда, где работает» часто уходит именно на него.
- Ставки, поднятые под такой товар, продолжают стоить денег, пока кто-то вручную не сверит рекламные заказы с фактическими отгрузками.
Поэтому честный знаменатель — не оформленные заказы, а выкупленные:
(расход на клики + бонусы продавца + расход на бонусы за отзывы) / выкупленные заказы, пришедшие с рекламы
И отдельно стоит вести долю отмен по рекламным заказам — в разрезе товаров, а не только по магазину. Это дешёвая метрика, которая быстро показывает, где реклама разгоняет заказы, не доходящие до покупателя.
По нашему опыту, после пересчёта по полной формуле с выкупленными заказами реальная стоимость заказа оказывается заметно выше той, что в отчёте, — насколько именно, зависит от категории, доли бонусов и доли отмен. Важна не конкретная цифра, а то, что до пересчёта её никто не видел.
Что делать на следующей неделе
- Свести все четыре расхода в одну таблицу по неделям, отдельно по каждому магазину.
- Разделить заказы на рекламные и органические — хотя бы по товарам, которые участвуют в рекламе.
- Сопоставить рекламные заказы с фактическими отгрузками и посчитать долю отмен и невыкупов по каждому товару.
- Посчитать полную стоимость заказа за прошлый месяц по выкупленным заказам.
- Зафиксировать её как базовый уровень. Без базового уровня любую оптимизацию не с чем сравнивать.
Куда двигаться дальше
Суточный отчёт — тоже слишком крупная единица: три дня с одинаковым расходом могут отличаться по заказам вдвое, а разница спрятана внутри суток. Следующий шаг после полной формулы — почасовые срезы по ставкам, позициям и расходу. Кабинет такую историю не хранит, её приходится создавать самостоятельно: снимок состояния раз в час по каждому товару, хранение в обычной реляционной базе, сравнение по неделям. Об этом — в следующем материале.

 Share