
The post has been translated automatically. Original language: Russian




Reactive development is not a problem for a specific team. This is a systemic defect in the tools used by the industry.
Working with product teams in the B2B/B2C segment and researching the product strategy of a technology company, I came across the same limitation over and over again: ICE, RICE, MoSCoW, WSJF - each of these frameworks solves its task well, but they all evaluate the backlog as a static object. Priorities are set once and live until the next iteration of planning, regardless of whether the company's strategy has changed, whether a new partner has arrived, or whether the focus of the quarter has shifted.
As a result, the team moves on a map that no longer corresponds to the terrain. This is reactivity — not as a character trait, but as a structural consequence of the tools used. It was this observation that became the starting point for developing our own model.
What are the existing frameworks missing?
Let's look at the five most common approaches.:
- ICE (Impact / Confidence/Ease) is fast and simple, but tends towards tasks with high Ease. The team chooses the "easy" rather than the "strategically important".
- RICE adds audience reach, which increases accuracy, but also doesn't know anything about where the business is heading this quarter.
- SAFE's WSJF methodology takes into account urgency through the cost of delay, but requires a mature organizational culture and is often redundant for teams of up to 30 people.
- MoSCoW and Kano are categorical models. They help to classify, but not to rank. Within the "Must have" category, the order is still subject to negotiation.
The general conclusion is that none of the listed methods contains a mechanism that translates current business priorities directly into the numerical rating of the backlog.
The ICES Model: Strategic alignment as a measurable parameter
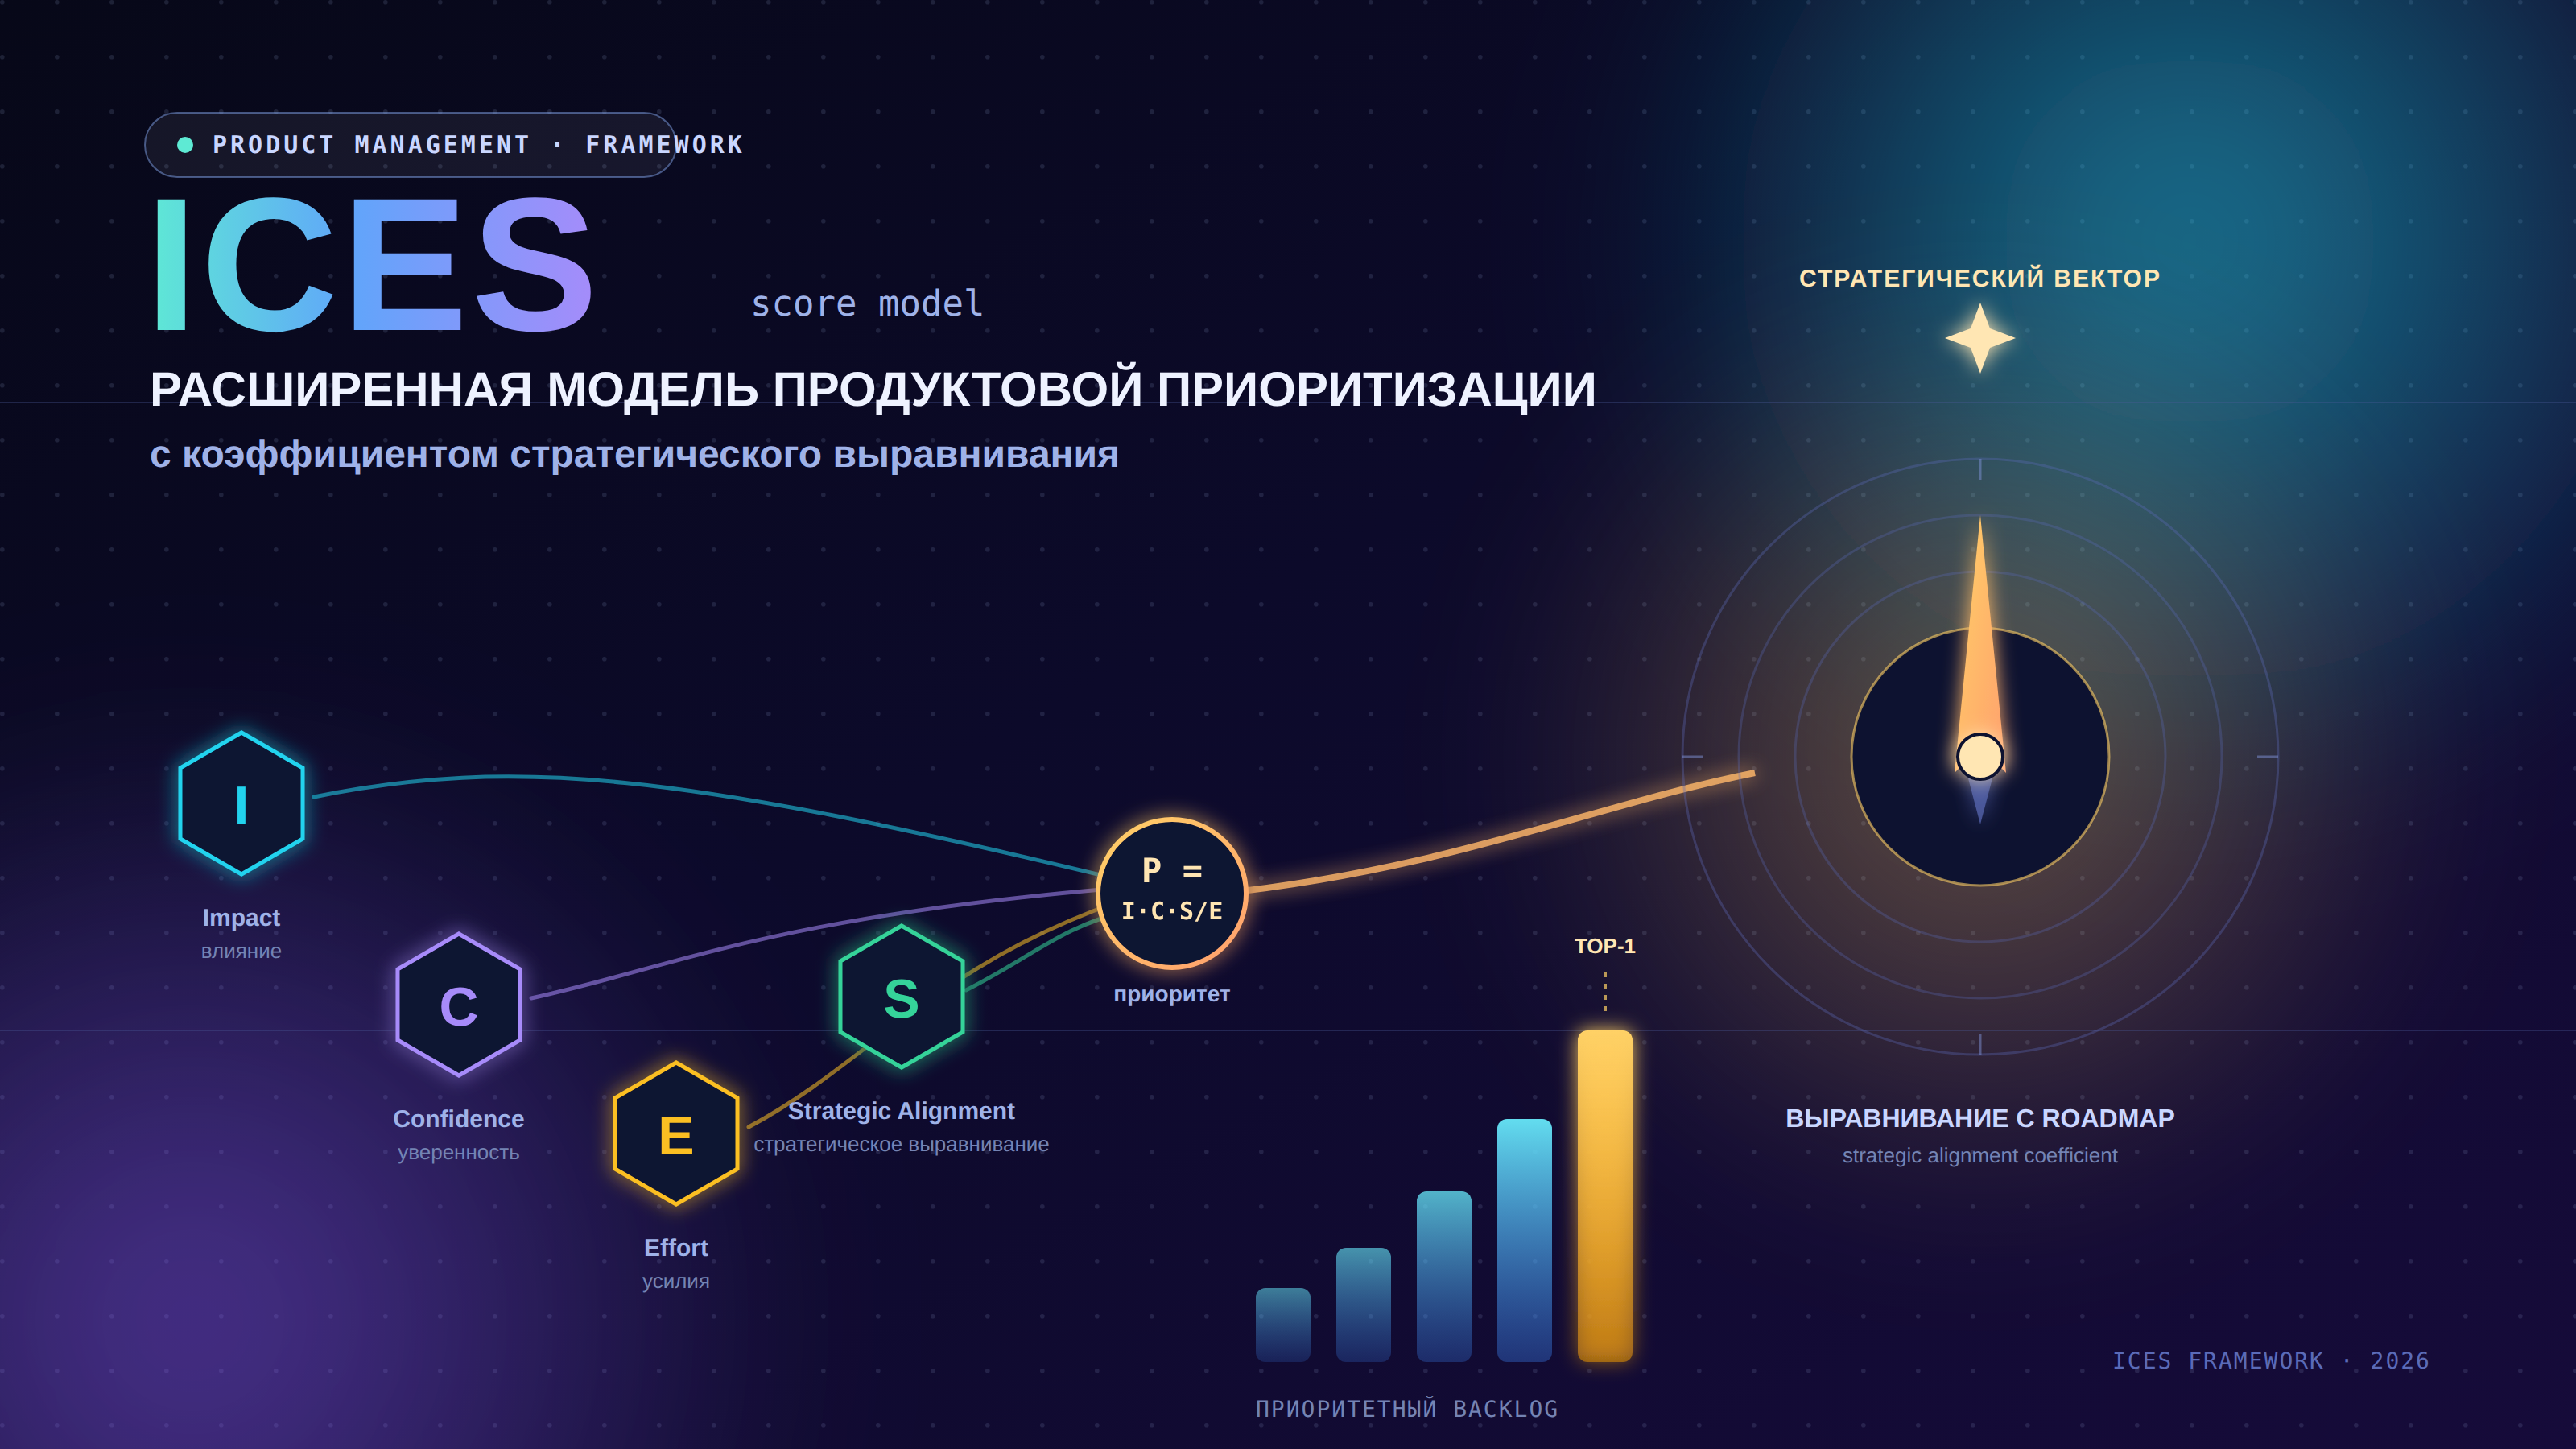
As part of my research on the technology company's product strategy, I have developed an extended ICES prioritization model — Impact, Confidence, Ease, and Strategic alignment. The model is described by me in a scientific article, and is an author's extension of the classic ICE.
Formula:
ICES = ((I + C + E) / 3) × Ks
Ks is the coefficient of strategic alignment. It reflects the degree of compliance of the feature with the priority business area in the current quarter.
The mechanics consists of three elements:
1. Tagging the backlog. Each feature gets a tag of the department or direction for which it is created, for example: Sales, Marketing, Aftersales, Customer Relations, etc. Up to two tags are allowed — the main one and the adjacent one.
2. Fixing the quarterly priority. At the beginning of the quarter, the priority direction is determined at the OKR session and recorded in the metrics showcase. The decision is made at the CPO or CEO level and is not reviewed during the quarter.
3. Calculation of Ks. Features with a tag that matches the priority area get Ks = 1.25. If there is a partial match (one of the two tags), get Ks = 1.125. If there is no match, Ks = 1.0.
Why 1.25 and not higher?
The goal of the coefficient is to adjust the rating, not to rewrite it. With a value of 1.5 or higher, features with a priority tag automatically displace everything else, regardless of the content assessment. This makes the model meaningless. At Ks = 1.25, strategic alignment affects the position only where the ICE scores are comparable. The product manager retains the analytical role - the model enhances it, not replaces it.
Approbation: the car market's mobile app
The model was tested on a mobile application case for the passenger car market with an audience of 100,000 MAU. The company records a decline in market share and sets a quarterly OKR for the growth of new customers and sales.
Quarterly priority: Sales dept. Ks = 1.25 for features with the Sales tag.
Consider a backlog of five features:
Integration of the Admin Panel with the dealer's CRM — requests directly, transactions are not lost [Sales]
An advertising banner on the main page with a redirect to the [Marketing] section
Stories in the Community section — users share photos [Customer Relations]
Trade-in calculator in the Garage — residual value and exchange for a new car [Sales]
Maintenance Cost Calculator — budgeting trips to the service [Aftersales]
The result of the standard ICE model:
1. Advertising banner — 7.33
2. CRM integration — 7.00
3-4. Trade-in calculator / Calculator TO — 6.67
5. Stories — 4.67
The banner comes first, solely due to its high ease of implementation (Ease = 9). Strategically important features lose out to a "quick win".
The result of the ICES model:
1. CRM integration — 8.75 (7.00 × 1.25)
2. Trade-in calculator — 8.33 (6.67 × 1.25)
3. Advertising banner — 7.33 (unchanged)
4. Calculator TO — 6.67
5. Stories — 4.67
CRM integration comes out on top. It shortens the transaction cycle and eliminates the loss of orders — a direct hit to the target of the quarter. The trade-in calculator rises to the second level: it forms a funnel from realizing the value of the exchange to buying a new car.
The banner remains in the sprint, in third place. The model does not cancel out the tasks of other areas, it builds a reasonable hierarchy between them.
What changes ICES in practice?
For a product manager, it is an argumentation tool. When a stakeholder asks why a "boring" integration was used in the sprint instead of a "bright" banner, the answer is now expressed in numbers — and these numbers are based on a decision that the business made itself at the OKR session.
For a business, this is a mechanism for translating strategy into the operational layer. Quarterly priorities stop getting lost between the meeting and the sprint planning.
The model is applicable to any scoring framework — ICE, RICE, WSJF. Categorical methods (MoSCoW, Kano) are incompatible with the multiplicative operation by their nature.
Directions for further research
The next step is empirical validation: a survey of product managers to calibrate the Ks value and a correlation analysis of the ICES rating with actual business results on real backlogs. It is also of interest to adapt the coefficient for multilevel OKR structures, where there may be several priorities with different weights.
The full version of the article with an academic review of the frameworks, a formal description of the model, and calculations will soon be published in the journal.
If the topic responds, I will be glad to discuss it in the comments. The experience of those who have already tried to formalize the strategic context in prioritization is especially interesting.: How are you dealing with this now?
Реактивная разработка — это не проблема конкретной команды. Это системный дефект инструментов, которыми пользуется отрасль.
Работая с продуктовыми командами в B2B/B2C-сегменте и исследуя продуктовую стратегию технологической компании, я столкнулся с одним и тем же ограничением снова и снова: ICE, RICE, MoSCoW, WSJF — каждый из этих фреймворков решает свою задачу хорошо, но все они оценивают бэклог как статичный объект. Приоритеты выставляются один раз и живут до следующей итерации планирования — вне зависимости от того, изменилась ли стратегия компании, пришёл ли новый партнёр, сместился ли фокус квартала.
В результате команда движется по карте, которая перестала соответствовать местности. Это и есть реактивность — не как черта характера, а как структурное следствие применяемых инструментов. Именно это наблюдение стало отправной точкой для разработки собственной модели.
Чего не хватает существующим фреймворкам
Рассмотрим пять наиболее распространённых подходов:
- ICE (Impact / Confidence / Ease) — быстрый и простой, но тяготеет к задачам с высоким Ease. Команда выбирает «лёгкое», а не «стратегически важное».
- RICE добавляет охват аудитории (Reach), что повышает точность, но также не знает ничего о том, куда бизнес движется в этом квартале.
- WSJF из методологии SAFe учитывает срочность через стоимость задержки, но требует зрелой организационной культуры и часто избыточен для команд до 30 человек.
- MoSCoW и Kano — категориальные модели. Они помогают классифицировать, но не ранжировать. Внутри категории «Must have» порядок всё равно остаётся предметом переговоров.
Общий вывод: ни один из перечисленных методов не содержит механизма, который транслирует текущие бизнес-приоритеты непосредственно в числовой рейтинг бэклога.
Модель ICES: стратегическое выравнивание как измеримый параметр
В рамках исследования продуктовой стратегии технологической компании я разработал расширенную модель приоритизации ICES — Impact, Confidence, Ease, Strategic alignment. Модель описана мной в научной статье, и представляет собой авторское расширение классического ICE.
Формула:
ICES = ((I + C + E) / 3) × Ks
Ks — коэффициент стратегического выравнивания. Он отражает степень соответствия фичи приоритетному направлению бизнеса в текущем квартале.
Механика состоит из трёх элементов:
1. Тегирование бэклога. Каждая фича получает тег департамента или направления, для которого она создаётся, например: Sales, Marketing, Aftersales, Customer Relations и т.д. Допускается до двух тегов — основной и смежный.
2. Фиксация квартального приоритета. В начале квартала на OKR-сессии определяется приоритетное направление и фиксируется в витрине метрик. Решение принимается на уровне CPO или CEO и не пересматривается в течение квартала.
3. Расчёт Ks. Фичи с тегом, совпадающим с приоритетным направлением, получают Ks = 1.25. При частичном совпадении (один из двух тегов) — Ks = 1.125. При отсутствии совпадения — Ks = 1.0.
Почему 1.25, а не выше?
Задача коэффициента — скорректировать рейтинг, а не переписать его. При значении 1.5 и выше фичи с приоритетным тегом автоматически вытесняют всё остальное вне зависимости от содержательной оценки. Это лишает модель смысла. При Ks = 1.25 стратегическое выравнивание влияет на позицию только там, где ICE-баллы сопоставимы. Продакт-менеджер сохраняет аналитическую роль — модель её усиливает, а не замещает.
Апробация: мобильное приложение авторынка
Модель была проверена на кейсе мобильного приложения для рынка легковых автомобилей с аудиторией 100 000 MAU. Компания фиксирует снижение доли рынка и ставит квартальный OKR на рост новых клиентов и объёма продаж.
Квартальный приоритет: Sales dept. Ks = 1.25 для фич с тегом Sales.
Рассмотрим бэклог из пяти фичей:
Интеграция Admin Panel с CRM дилера — заявки напрямую, сделки не теряются [Sales]
Рекламный баннер на главной с редиректом в раздел [Marketing]
Сторисы в разделе Community — пользователи делятся фото [Customer Relations]
Trade-in калькулятор в Гараже — остаточная стоимость и обмен на новый авто [Sales]
Калькулятор стоимости ТО — бюджетирование поездок на сервис [Aftersales]
Результат стандартной модели ICE:
1. Рекламный баннер — 7.33
2. CRM-интеграция — 7.00
3–4. Trade-in калькулятор / Калькулятор ТО — 6.67
5. Сторисы — 4.67
На первом месте оказывается баннер — исключительно за счёт высокой лёгкости реализации (Ease = 9). Стратегически значимые фичи проигрывают «быстрой победе».
Результат модели ICES:
1. CRM-интеграция — 8.75 (7.00 × 1.25)
2. Trade-in калькулятор — 8.33 (6.67 × 1.25)
3. Рекламный баннер — 7.33 (без изменений)
4. Калькулятор ТО — 6.67
5. Сторисы — 4.67
CRM-интеграция выходит на первое место. Она сокращает цикл сделки и устраняет потери заявок — прямое попадание в цель квартала. Trade-in калькулятор поднимается на второе: он формирует воронку от осознания ценности обмена до покупки нового автомобиля.
Баннер остаётся в спринте — на третьем месте. Модель не отменяет задачи других направлений, она выстраивает между ними обоснованную иерархию.
Что меняет ICES на практике
Для продакт-менеджера - это инструмент аргументации. Когда стейкхолдер спрашивает, почему в спринт взята «скучная» интеграция вместо «яркого» баннера, ответ теперь выражен в числах — и эти числа основаны на решении, которое бизнес принял сам на OKR-сессии.
Для бизнеса это механизм трансляции стратегии в операционный уровень. Квартальные приоритеты перестают теряться между совещанием и планированием спринта.
Модель применима к любому скоринговому фреймворку — ICE, RICE, WSJF. Категориальные методы (MoSCoW, Kano) несовместимы с мультипликативной операцией по своей природе.
Направления дальнейших исследований
Следующим этапом является эмпирическая валидация: опрос продакт-менеджеров для калибровки значения Ks и корреляционный анализ ICES-рейтинга с фактическими бизнес-результатами на реальных бэклогах. Также представляет интерес адаптация коэффициента для многоуровневых OKR-структур, где приоритетов может быть несколько с разными весами.
Полная версия статьи с академическим обзором фреймворков, формальным описанием модели и расчётами скоро будет опубликована в журнале.
Если тема откликается, то буду рад обсудить в комментариях. Особенно интересен опыт тех, кто уже пробовал формализовать стратегический контекст в приоритизации: как вы с этим справляетесь сейчас?
 Share