
The post has been translated automatically. Original language: Russian




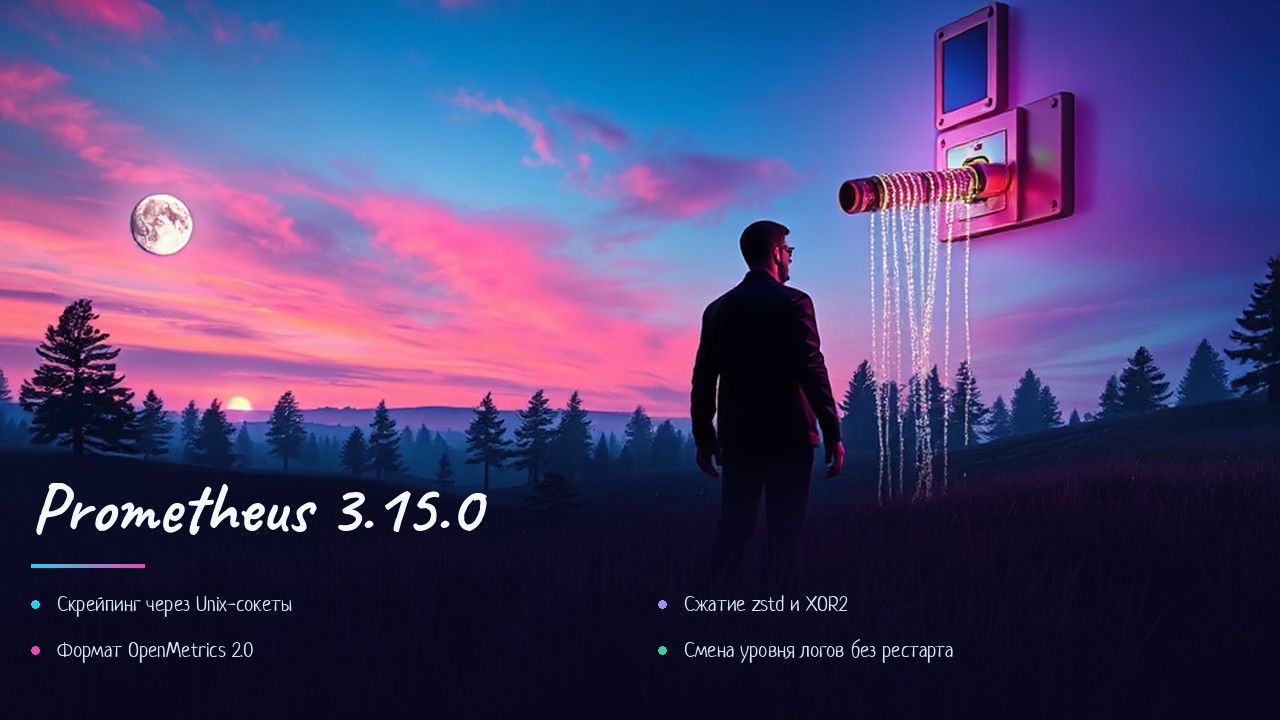
On September 24, 2026, Prometheus 3.15.0 was released, the next minor release of the most widespread open monitoring system. The update turned out to be rich: new ways to collect metrics, support for the OpenMetrics 2.0 format, logging level management without restarting the process, and a large portion of fixes in the TSDB time series storage engine.
Scraping: Unix sockets, OpenMetrics 2.0 and zstd
Prometheus has learned how to collect metrics through the Unix domain socket. The request for this feature has been hanging in the project tracker for several years, and now exporters running on the same machine as the server do not have to publish on the TCP port at all: the attack surface is smaller, the traffic filtering rules are simpler. In addition, the OpenMetrics 2.0 scrape format has been implemented, and the zstd-scrap feature has added support for exporter responses compressed by the zstd algorithm, which significantly saves traffic when capturing large sets of metrics over the network.
Target detection for Docker has received two new labels — the name of the container image and its identifier. Now the container metrics can be linked to a specific version of the image right at the stage of the reblibling, without connecting third-party exporters.
Operation: log level and memory limit are changed on the fly
The logging level is now set by the runtime.log_level parameter in the configuration and is applied by a regular reboot of the config — you no longer need to restart the server. The old log.level command line flag has been deprecated. The second operational novelty is the auto—gomemlimit.refresh-interval flag: the server periodically re-reads the container's memory limit and updates the GOMEMLIMIT limit of the Go runtime. If the orchestrator changes the limits on a live container, Prometheus will adjust itself.
Storage: XOR2 is stabilized, data loss is eliminated
The encoding of XOR2 chunks for floating-point numbers has been declared stable: instead of a feature flag, it is enabled by configuring chunk_encoding storage. An accelerated path for unpacking XOR chunks during reading has been added, and the processor load has been reduced during head block initialization.
The fixes in TSDB deserve special attention: the silent loss of samples during garbage collection in the head block during competitive recording, possible mutual blocking when chunks are mapped to memory, panics when series are preempted after playing the WAL log, and WAL corruption after unsuccessful recording in agent mode have been eliminated. The TSDB dump command was repaired separately in the promtool utility — it silently threw out samples of native histograms.
What does this mean in practice?
The update should be planned more carefully than usual. First, if the logging level flag is set in the startup scripts, move it to the configuration in advance, the deprecation has already been announced. Secondly, if you enabled experimental XOR2 encoding with the feature flag, switch to the new storage setting during the upgrade. Thirdly, correcting the silent loss of samples and damage to the WAL is a good argument not to delay the update for those who work in agent mode with remote write: such defects are not visible in the logs, but they spoil the data. Finally, scraping over Unix sockets is a good reason to reconsider the scheme of local exporters: node_exporter and its analogues on the same host are no longer required to listen to the network.
The draft text was prepared with the participation of AI, the facts are checked against the original source — the official release notes of Prometheus 3.15.0 on GitHub.
24 сентября 2026 года вышел Prometheus 3.15.0 — очередной минорный релиз самой распространённой открытой системы мониторинга. Обновление получилось насыщенным: новые способы сбора метрик, поддержка формата OpenMetrics 2.0, управление уровнем логирования без перезапуска процесса и большая порция исправлений в движке хранения временных рядов TSDB.
Скрейпинг: Unix-сокеты, OpenMetrics 2.0 и zstd
Prometheus научился собирать метрики через Unix domain socket. Запрос на эту возможность висел в трекере проекта несколько лет, и теперь экспортёры, работающие на одной машине с сервером, можно вообще не публиковать на TCP-порту: меньше поверхность атаки, проще правила фильтрации трафика. Кроме того, реализован формат скрейпа OpenMetrics 2.0, а за фича-флагом zstd-scrape появилась поддержка ответов экспортёров, сжатых алгоритмом zstd, — это заметно экономит трафик при съёме больших наборов метрик по сети.
Обнаружение целей для Docker получило две новые метки — имя образа контейнера и его идентификатор. Теперь метрики контейнера можно связать с конкретной версией образа прямо на этапе релейблинга, не подключая сторонние экспортёры.
Эксплуатация: уровень логов и лимит памяти меняются на лету
Уровень логирования теперь задаётся параметром runtime.log_level в конфигурации и применяется обычной перезагрузкой конфига — перезапускать сервер больше не нужно. Старый флаг командной строки log.level объявлен устаревшим. Вторая эксплуатационная новинка — флаг auto-gomemlimit.refresh-interval: сервер периодически перечитывает лимит памяти контейнера и обновляет ограничение GOMEMLIMIT рантайма Go. Если оркестратор меняет лимиты на живом контейнере, Prometheus подстроится сам.
Хранилище: XOR2 стабилизировано, устранены потери данных
Кодирование чанков XOR2 для чисел с плавающей точкой объявлено стабильным: вместо фича-флага оно включается настройкой хранилища chunk_encoding. Добавлен ускоренный путь распаковки XOR-чанков при чтении, снижена нагрузка на процессор при инициализации head-блока.
Исправления в TSDB заслуживают отдельного внимания: устранены тихая потеря сэмплов при сборке мусора в head-блоке во время конкурентной записи, возможная взаимная блокировка при отображении чанков в память, паники при вытеснении серий после воспроизведения журнала WAL и повреждение WAL после неудачной записи в agent-режиме. Отдельно починили команду дампа TSDB в утилите promtool — она молча выбрасывала сэмплы нативных гистограмм.
Что это значит на практике
Обновление стоит планировать внимательнее обычного. Во-первых, если в скриптах запуска задан флаг уровня логирования — перенесите его в конфигурацию заранее, депрекация уже объявлена. Во-вторых, если вы включали экспериментальное кодирование XOR2 фича-флагом, при апгрейде переключитесь на новую настройку хранилища. В-третьих, исправления тихой потери сэмплов и повреждения WAL — веский аргумент не откладывать обновление тем, кто работает в agent-режиме с remote write: такие дефекты не видны в логах, но портят данные. Наконец, скрейпинг по Unix-сокетам — хороший повод пересмотреть схему локальных экспортёров: node_exporter и его аналоги на том же хосте больше не обязаны слушать сеть.
Черновик текста подготовлен с участием ИИ, факты сверены с первоисточником — официальные release notes релиза Prometheus 3.15.0 на GitHub.

 Share