Публикация была переведена автоматически. Исходный язык: Английский


Меня зовут Асхат Аубакиров, я недавно закончил курс Data Science, предоставленный OUTPEERKZ в рамках программы TechOrda.
Сегодня я участвую в проектах по науке о данных со своими студентами в Makerspace Petropavl, чтобы поделиться своими знаниями и вдохновить молодых людей присоединиться к миру науки о данных.
Вот что мы создали во время многих наших встреч. Следуйте за нами шаг за шагом, и вы поймете, как работают дата сайентисты.
Важно: при выполнении этого руководства, пожалуйста, не забудьте установить библиотеки через pip и обратиться к файлам в репозитории github (https://github.com/askhat-aubakirov/sentiment/tree/main)
- На этапе обучения: в Jupyter Notebook:
- Работа с набором данных:
--- Загрузка данных,
--- Описательный анализ данных (EDA, Exploratory Data Analysis),
--- Очистка данных,
--- Обработка данных,
--- Разработка функций.
- Подготовка к обучению:
--- Загрузка модели случайного леса,
--- Разделение данных на обучающие и тестовые массивы.
- Обучение и тестирование
- Сохранение модели - На этапе развертывания:
- Загрузка Streamlit
--- Создание визуального шаблона с элементами Streamlit
--- Адаптация функций из Jupyter Notebook для токенизации, лемматизации и векторизации пользовательских данных
--- извлечение только необходимых данных для развертывания
- Запуск приложения локально и тестирование процесса с пользователями - Репозиторий проекта на Github: https://github.com/askhat-aubakirov/sentiment
Мы изучим NLP (обработку естественного языка) и построим модель для классификации текстов по категориям тональности. В двух словах, это должно быть приложение, которое получало бы текст от пользователя и выдавало один из вердиктов, таких как "положительный", "отрицательный" и т.д.
Данные для решения этой проблемы легко найти на Kaggle. Вот ссылка: https://www.kaggle.com/datasets/jp797498e/twitter-entity-sentiment-analysis
import pandas as pd                                         #pandas for calculations
import matplotlib.pyplot as plt                             #matplotlib for plotting graphs in EDA steps
import re                                                   #regular expressions library to help us clean up the dataset
import spacy                                                #library for lemmatization function of ours
from sklearn.ensemble import RandomForestClassifier         #machine Learning model we're going to use
from sklearn.metrics import accuracy_score, f1_score        #metrics to measure our success
from sklearn.feature_extraction.text import TfidfVectorizer #method to convert words and text to a matrix
from sklearn.model_selection import train_test_split        #splitting the data to parts
import joblib #library to save the model locallyВы можете посмотреть, какие библиотеки мы импортировали на данный момент:
- pandas: используется для вычислений в матричной алгебре (мы собираемся сохранить наш набор данных и получить к нему доступ в виде матрицы).
- matplotlib: используется для создания графиков -> таким образом, мы увидим, является ли набор данных несбалансированным или слишком "грязным" с помощью статистики и визуальных элементов
- re: очень полезный инструмент для NLP, помогающий создавать выражения для распознавания сложных строк и манипулирования ими
- spacy: библиотека, содержащая предварительно загруженные стоп-слова и корпуса языка
- RandomForestClassifier: модель, которую мы собираемся использовать. (Что это такое? Вот некоторые наглядные пояснения: https://youtu.be/cIbj0WuK41w
- metrics: accuracy и F1 Score (подробнее ниже)
- TfidfVectorizer: отличный инструмент для преобразования слов в числовую матрицу - форму, удобоваримую алгоритмом.
- train_test_split: чтобы обучить модель и рассчитать показатели, вам понадобится несколько частей, а именно обучающий набор и тестовый набор.
- joblib: библиотека для сохранения обученной модели в одном файле -> мы будем использовать ее позже в процессе развертывания
EDA - это важный шаг в науке о данных для понимания ваших данных перед анализом. Он включает в себя:
- Расчет показателей: Вычисление статистических данных, таких как среднее значение, медиана, стандартное отклонение.
- Визуализация: создание графиков, таких как гистограммы, точечные графики и прямоугольные диаграммы.
- Очистка: обработка пропущенных значений и выбросов.
Пример для условного набора данных о продажах клиентов:
- Расчет показателей: Рассчитайте среднюю сумму покупки и количество уникальных клиентов.
- Визуализация: создайте гистограмму, чтобы увидеть распределение сумм покупок.
- Очистка: Обработайте пропущенные значения в адресах клиентов.
EDA помогает вам выявлять закономерности, взаимосвязи и потенциальные проблемы в ваших данных.
Перво-наперво мы загружаем данные (предварительно сохраненные из Kaggle):
data = pd.read_csv('twitter_training.csv')Затем мы продолжаем и просматриваем данные, используя метод head() из pandas:
data.head()И при этом получаем следующий результат:
	2401	Borderlands	Positive	im getting on borderlands and i will murder you all ,
0	2401	Borderlands	Positive	I am coming to the borders and I will kill you...
1	2401	Borderlands	Positive	im getting on borderlands and i will kill you ...
2	2401	Borderlands	Positive	im coming on borderlands and i will murder you...
3	2401	Borderlands	Positive	im getting on borderlands 2 and i will murder ...
4 2401 Borderlands Positive im getting into borderlands and i can murder y...Мы ясно видим, что в нем есть несколько идентификаторов (2401 и т.д.), названия продуктов (Borderlands и т.д.) и настроение (Позитивное и т.д. Другими словами, это класс). Но дело в том, что у нас здесь нет заголовков. Давайте добавим их:
data_valid.columns = ['ID', 'entity', 'sentiment', 'content']
data_valid.head(5) ID entity sentiment content
0 352 Amazon Neutral BBC News - Amazon boss Jeff Bezos rejects clai...
1 8312 Microsoft Negative @Microsoft Why do I pay for WORD when it funct...
2 4371 CS-GO Negative CSGO matchmaking is so full of closet hacking,...
3 4433 Google Neutral Now the President is slapping Americans in the...
4 6273 FIFA Negative Hi @EAHelp I’ve had Madeleine McCann in my cel...Теперь так лучше, заголовки у нас красивые и понятные.
Самое время сгенерировать несколько диаграмм и проанализировать набор данных статистически. Мы будем использовать matplotlib. Читайте внимательно -> код объясняется сам по себе.
# Get the entity labels from the DataFrame
entity_labels = data['entity']

entity_labels = data["entity"].value_counts() #count the values we have

print(entity_labels)

plt.figure(figsize=(12, 6))
entity_labels.plot(kind='bar')
plt.title('Value Counts of entities')
plt.xlabel('entity')
plt.ylabel('Count')
plt.xticks(fontsize=10) #decrease fontsize for readability - unfortunately, readablity is close to zero
plt.show()

plt.figure(figsize=(4, 4))
entity_labels.plot(kind='box')
plt.title('Value Counts of entities')
plt.xlabel('entity')
plt.ylabel('Count')
plt.xticks(fontsize=10)
plt.show()matplotlib называется plt. Мы просто вызываем встроенные методы для создания 2 типов графиков: столбчатой диаграммы и прямоугольного графика. Мы получаем это в качестве выходных данных:
entity
TomClancysRainbowSix                 2400
MaddenNFL                            2400
Microsoft                            2400
LeagueOfLegends                      2394
CallOfDuty                           2394
Verizon                              2382
CallOfDutyBlackopsColdWar            2376
ApexLegends                          2376
Facebook                             2370
WorldOfCraft                         2364
Dota2                                2364
NBA2K                                2352
TomClancysGhostRecon                 2346
Battlefield                          2346
FIFA                                 2340
Xbox(Xseries)                        2334
Overwatch                            2334
johnson&johnson                      2328
Amazon                               2316
PlayStation5(PS5)                    2310
HomeDepot                            2310
Cyberpunk2077                        2304
CS-GO                                2304
GrandTheftAuto(GTA)                  2304
...
Fortnite                             2274
RedDeadRedemption(RDR)               2262
AssassinsCreed                       2244
Name: count, dtype: int64В результате мы получаем информацию о количестве объектов в наборе данных. Набор данных сбалансирован (поскольку его бережно отобрали авторы), поэтому у нас есть "минус один" к числу проблем, связанных с данными, которые необходимо решить.


Оба графика показывают практически идеально сбалансированные данные. Это означает, что в процессе обучения, скорее всего, будет получена довольно точная модель. Давайте двигаться дальше.
Мы знаем, что у нас есть текстовые данные. Но они грязные. Твиты, с которыми мы работаем, полны опечаток, знаков препинания, упоминаний других пользователей, URL-адресов и цифр.
Мы определяем функцию для удаления ненужных символов, которая называется clean_tweet.
def clean_tweet(text):
    if isinstance(text, str):
        text = text.lower()  # Convert to lowercase
        text = re.sub(r'http\S+|www\S+|https\S+', '', text, flags=re.MULTILINE)  # Remove URLs
        text = re.sub(r'\@\w+|\#', '', text)  # Remove mentions and hashtags
        text = re.sub(r'[^\w\s]', '', text)  # Remove punctuation
        text = re.sub(r'\d+', '', text)  # Remove numbers
    else:
        text = ''  # Handle non-string inputs like float (NaN) by returning an empty string or handling as needed

return textОсновная часть здесь - это используемая библиотека re. Это библиотека регулярных выражений.
Например, регулярное выражение http\S+|www\S+|https\S+ используется для сопоставления URL-адресов в тексте. Вот разбивка по его компонентам:
- http\S+: Соответствует строке "http", за которой следует один или несколько символов, отличных от пробелов. Здесь отображаются URL-адреса HTTP.
- www\S+: Соответствует строке "www", за которой следует один или несколько символов, отличных от пробелов. При этом отображаются URL-адреса, начинающиеся с "www".
- https\S+: Соответствует строке "https", за которой следует один или несколько символов, отличных от пробелов. При этом отображаются URL-адреса HTTPS.
- Символ | - это символ, который действует как оператор "или", позволяя регулярному выражению соответствовать любому из трех шаблонов.
Теперь мы используем метод apply(), чтобы применить эту функцию к каждому элементу набора данных:
# Apply the cleaning function to the 'content' column
data['clean_content'] = data['content'].apply(clean_tweet)Отличная работа. Теперь в нашем наборе данных есть столбец с чистым текстом:
data.head(5) ID entity sentiment content clean_content
0 2401 Borderlands Positive I am coming to the borders and I will kill you... i am coming to the borders and i will kill you...
1 2401 Borderlands Positive im getting on borderlands and i will kill you ... im getting on borderlands and i will kill you all
2 2401 Borderlands Positive im coming on borderlands and i will murder you... im coming on borderlands and i will murder you...
3 2401 Borderlands Positive im getting on borderlands 2 and i will murder ... im getting on borderlands and i will murder y...
4 2401 Borderlands Positive im getting into borderlands and i can murder y... im getting into borderlands and i can murder y...Теперь самое интересное в NLP! Взгляните на объяснения этих трех процессов:
- Токенизация: Разбиение текста на более мелкие элементы (токены).
- Пример: "Быстрая бурая лиса перепрыгивает через ленивую собаку" становится ["Та", "быстрая", "бурая", "лиса", "перепрыгивает", "через", "та", "ленивая", "собака"].
- Лемматизация: Приведение слов к их корневой форме (лемма).
- Пример: "бегущий", "runs", "ran" сокращаются до "run".
- Векторизация: Преобразование текста в числовые представления (векторы).
- Пример: Использование таких методов, как Bag-of-Words (BoW) или TF-IDF, для представления текста в виде числовых векторов.
А теперь код:
nlp = spacy.load('en_core_web_sm')

def tokenize_and_lemmatize(text):
  """
  Tokenizes and lemmatizes the input text.

  Args:
      text: A string representing the input text.

  Returns:
      a list of lemmas
  """
  lemmas = []

  doc = nlp(text)

  for token in doc:
      if token.is_alpha and not token.is_stop:
          lemmas.append(token.lemma_)

  new_lemma_tokens = " ".join(lemmas) #Arsen was right -> I had indentation error

return new_lemma_tokensdata['lemmas'] = data['clean_content'].apply(tokenize_and_lemmatize)И когда мы сейчас взглянем на набор данных, мы увидим что-то вроде этого:
        ID	entity	    sentiment	content	                                                clean_content	                                        lemmas
0	352	Amazon	    Neutral	BBC News - Amazon boss Jeff Bezos rejects clai...	bbc news amazon boss jeff bezos rejects claim...	bbc news amazon boss jeff bezos rejects claim ...
1	8312	Microsoft   Negative	@Microsoft Why do I pay for WORD when it funct...	why do i pay for word when it functions so po...	pay word function poorly chromebook
2	4371	CS-GO	    Negative	CSGO matchmaking is so full of closet hacking,...	csgo matchmaking is so full of closet hacking ...	csgo matchmaking closet hack truly awful game
3	4433	Google	    Neutral	Now the President is slapping Americans in the...	now the president is slapping americans in the...	president slap americans face commit unlawful ...
4 6273 FIFA Negative Hi @EAHelp I’ve had Madeleine McCann in my cel... hi ive had madeleine mccann in my cellar for ... hi ve madeleine mccann cellar past year little...Давайте посмотрим, какие изменения в тексте мы внесли к настоящему времени: например, исходный текст "@Microsoft Why do I pay for WORD when it funct..." превратился в "why do i pay for word when it functions so po...", а затем стал "pay word function poorly chromebook".
Фокус в том, что смысл твита остается вполне понятным, когда читаешь только леммы, а не каждое слово.

А теперь о векторизации. Это преобразование в числа. Нам нужно заполнить матрицы моделей числами, а не словами. Для этой задачи мы будем использовать векторизатор TF-IDF:


Он работает следующим образом:
1) Мы получаем токены (слова, термины) x и вычисляем, сколько раз они присутствуют в документе y, затем мы вычисляем частоту использования термина x в этом документе y -> это TF_x,y
2) Мы умножаем TF_x,y на IDF (который является логарифмом общего количества документов, деленного на количество документов, содержащих термин x).
Это дает нам отличное представление о важности слова. Например, у нас может быть много таких слов, как "я", "есть", "мы" и т.д. Хотя их много, они не очень важны. С другой стороны, у нас может быть всего несколько упоминаний таких слов, как "счастливый", "злой" или что-то в этом роде, но они важны.
Итак, векторизатор TF-IDF выдает относительные коэффициенты частоты (любые значения с плавающей точкой от 0 до 1), по которым мы можем оценить важность терминов.
Вот как это выглядит в коде:
#vectorizing the lemmatized text -> this is basically Feature Engineering, cause we have text data and define max_features
vectorizer = TfidfVectorizer(lowercase=False, max_features=10000, ngram_range=(1, 2))
vectorized_data = vectorizer.fit_transform(data['lemmas'].values.astype('U'))
vectorized_data = pd.DataFrame(vectorized_data.toarray(), columns=vectorizer.get_feature_names_out())Объяснение:
vectorizer = TfidfVectorizer(lowercase=False, max_features=10000, ngram_range=(1, 2)) создает векторизатор с параметрами, такими как нижний lowercase=False, потому что ранее применялся нижний регистр, max_features=10000 для определения количества столбцов (фичей, features) и ngram_range=(1, 2), чтобы объекты состояли из не только из отдельных слов, но и из сочетаний двух слов.
Это довольно удобно, поскольку, например, в случае с медицинскими данными такие слова, как "сердце" и "приступ", могут иметь разные значения, но "сердечный приступ" имеет более важное значение.
Теперь набор данных, который у нас есть, выглядит следующим образом и имеет форму 74681 х 10000:
aa	aa aa	aaa	aaron	ab	abandon	abandon sanction	abc	abella	abella danger	...	zero dawn	zion	zip	zoe	zombie	zone	zonestreamcx	zoom	zsmitty	zuckerberg
0	0.0	0.0	0.0	0.0	0.0	0.0	0.0	0.0	0.0	0.0	...	0.0	0.0	0.0	0.0	0.0	0.0	0.0	0.0	0.0	0.0
1	0.0	0.0	0.0	0.0	0.0	0.0	0.0	0.0	0.0	0.0	...	0.0	0.0	0.0	0.0	0.0	0.0	0.0	0.0	0.0	0.0
2	0.0	0.0	0.0	0.0	0.0	0.0	0.0	0.0	0.0	0.0	...	0.0	0.0	0.0	0.0	0.0	0.0	0.0	0.0	0.0	0.0
3	0.0	0.0	0.0	0.0	0.0	0.0	0.0	0.0	0.0	0.0	...	0.0	0.0	0.0	0.0	0.0	0.0	0.0	0.0	0.0	0.0
4	0.0	0.0	0.0	0.0	0.0	0.0	0.0	0.0	0.0	0.0	...	0.0	0.0	0.0	0.0	0.0	0.0	0.0	0.0	0.0	0.0
5	0.0	0.0	0.0	0.0	0.0	0.0	0.0	0.0	0.0	0.0	...	0.0	0.0	0.0	0.0	0.0	0.0	0.0	0.0	0.0	0.0
6	0.0	0.0	0.0	0.0	0.0	0.0	0.0	0.0	0.0	0.0	...	0.0	0.0	0.0	0.0	0.0	0.0	0.0	0.0	0.0	0.0
7	0.0	0.0	0.0	0.0	0.0	0.0	0.0	0.0	0.0	0.0	...	0.0	0.0	0.0	0.0	0.0	0.0	0.0	0.0	0.0	0.0
8	0.0	0.0	0.0	0.0	0.0	0.0	0.0	0.0	0.0	0.0	...	0.0	0.0	0.0	0.0	0.0	0.0	0.0	0.0	0.0	0.0
9 0.0 0.0 0.0 0.0 0.0 0.0 0.0 0.0 0.0 0.0 ... 0.0 0.0 0.0 0.0 0.0 0.0 0.0 0.0 0.0 0.0Обратите внимание, что в нем содержится 10 000 слов и сочетаний слов, каждое из которых имеет свою частоту в документах. Теперь это матрица, которую мы можем использовать в модели.
Мы должны разделить набор данных, чтобы обучить его, а затем протестировать, чтобы получить наши показатели.

На данный момент мы находимся в левой части схемы. У нас есть наша матрица характеристик и наши классы. Нам нужно разделить ее на X_train, y_train (обучающая матрица, или "вопросы", и целевые классы, или "ответы"). Плюс X_test и y_test. Нам это нужно, чтобы проверить, насколько хорошо (или плохо) работает наша модель.
X_train, X_test, y_train, y_test = train_test_split(vectorized_data, data['sentiment'], test_size=0.2, random_state=42)Модель, с которой мы будем работать, - это классификатор случайного леса.

- Выборка с начальной загрузкой: Случайная выборка с заменой: Из исходного набора данных создается несколько подмножеств (выборок с начальной загрузкой). Каждое подмножество может содержать повторяющиеся экземпляры.
- Случайная выборка с заменой: Из исходного набора данных создается несколько подмножеств (выборок начальной загрузки). Каждое подмножество может содержать повторяющиеся экземпляры.
- Построение дерева решений: Случайный выбор объектов: Для каждого дерева из общего числа объектов выбирается случайное подмножество объектов.Рост дерева решений: Каждое дерево решений увеличивается до максимальной глубины без обрезки.
- Случайный выбор объектов: Для каждого дерева выбирается случайное подмножество объектов из общего числа.
- Рост дерева решений: Каждое дерево решений увеличивается до максимальной глубины без обрезки.
- Предсказание: Голосование: Чтобы сделать прогноз для нового экземпляра, каждое дерево решений проводит голосование. Класс, набравший наибольшее количество голосов, выбирается в качестве окончательного прогноза.
- Голосование: Чтобы сделать прогноз для нового экземпляра, каждое дерево решений проводит голосование. Класс, набравший наибольшее количество голосов, будет выбран в качестве окончательного прогноза.
rf = RandomForestClassifier(n_estimators=100, random_state=42)

rf.fit(X_train, y_train)n_estimators в классификаторе случайных лесов относится к числу деревьев решений, которые выращиваются.
random_state=42 - это что-то вроде начального значения, используемого для обеспечения воспроизводимости. Кроме того, это отсылка к книге "Автостопом по Галактике", где цивилизация спрашивает, в чем смысл жизни, и получает ответ "42" от самого большого компьютера в галактике. Это довольно забавно, не так ли?
Когда модель случайного леса завершит обучение (у меня это заняло 11 минут), она покажет вот это:

Теперь давайте протестируем ее. Мы делаем прогнозы на основе нашего набора X_test, получая y_pred в качестве выходных данных, а затем сравниваем результаты с y_test с помощью таких показателей, как accuracy (точность) и F1 Score.
Вот объяснение того, что это за показатели (наряду с другими показателями):

А теперь код и выходные данные:
y_pred = rf.predict(X_test)

accuracy = accuracy_score(y_test, y_pred)
f1 = f1_score(y_test, y_pred, average='macro')

print("Accuracy:", accuracy)
print("F1 score:", f1)Accuracy: 0.8594764678315592
F1 score: 0.8567240271159241Мы можем сказать, что точность нашей модели составляет 86,95%, а показатель F1 - 85,67%
Давайте теперь протестируем модель на нашем "органическом" образце.
Просто дайте модели немного придуманного текста в качестве входных данных, но не забудьте предварительно обработать его (очистка, токенизация, лемматизация, векторизация + сравнение и изменение формата -> столбцы входной матрицы должны совпадать со столбцами матрицы train сета).
Вот код для этого:
nlp = spacy.load('en_core_web_sm', disable=['parser', 'ner'])
headers = pd.read_csv("headers_only.csv")
rf_model = joblib.load('rf_model.joblib')
vectorizer = TfidfVectorizer(lowercase=False, max_features=10000, ngram_range=(1, 2))

def tokenize_and_lemmatize(text):
  """
  Tokenizes and lemmatizes the input text.

  Args:
      text: A string representing the input text.

  Returns:
      a list of lemmas
  """
  lemmas = []

  doc = nlp(text)

  for token in doc:
      if token.is_alpha and not token.is_stop:
          lemmas.append(token.lemma_)
          new_lemma_tokens = " ".join(lemmas)

  return new_lemma_tokens

def predict_condition(user_input):
  """
  Preprocesses user input, predicts skin condition using the SVM model,
  and returns the prediction result.

  Args:
      user_input: A string representing the user's description.

  Returns:
      A string with the predicted skin condition.
  """
  try:
      # Lowercase and remove punctuation
      #user_input = user_input.lower()
      #user_input = "".join([char for char in user_input if char.isalnum() or char.isspace()])

      # Tokenize and lemmatize
      # lemmatized_text = tokenize_and_lemmatize(user_input)

      # Vectorize the text
      vectorized_input = vectorizer.fit_transform([user_input])
      vectorized_input = pd.DataFrame(vectorized_input.toarray(), columns=vectorizer.get_feature_names_out())
      #vectorized_input = pd.DataFrame(vectorized_input)

      # Load missing columns from training data (if any)
      missing_columns = set(headers.columns) - set(vectorized_input.columns)
      vectorized_input = vectorized_input.reindex(columns=headers.columns, fill_value=0)

      vectorized_input = vectorized_input[headers.columns]

      # Predict using the model
      prediction = rf_model.predict(vectorized_input)[0]

      # Return the prediction result
      return prediction

  except Exception as e:
      # Handle potential errors during preprocessing or prediction
      error_message = f"An error occurred: {str(e)}"
      return None

user_input = "YAY my model works fine and quite fast! Let's test it"
user_input = user_input.lower()

prediction = predict_condition(user_input)
print(prediction)Обратите внимание на эти строки:
- missing_columns = set(headers.columns) - set(vectorized_input.columns)
- vectorized_input = vectorized_input.reindex(columns=headers.columns, fill_value=0)
Они предназначены для того, чтобы убедиться, что столбцы набора цепочек совпадают с столбцами входных данных. Это простое представление механизма, практически такого же, как когда человек распознает только те слова, которые он знает из речи. Для слов, которых наша модель не знает, она просто добавит нули, что эквивалентно игнорированию нами того, чего мы не знаем о слове или нескольких словах в чьей-либо речи.
Итак, вывод для "YAY my model works fine and quite fast! Let's test it" является положительным
PositiveТеперь давайте превратим это в приложение. Streamlit - это простая библиотека, которую можно использовать специально для дата сайентистов, поскольку она отвечает за рендеринг всего пользовательского интерфейса.
Помните, что для приложения streamlit вам необходимо, чтобы вводимый пользователем текст проходил все этапы предварительной обработки, как описано выше. Но дело в том, что мы загрузили весь наш набор данных для обучения в Jupyter Notebook, который нам здесь не нужен, так как набор данных очень большой. Нам нужны только заголовки, поэтому мы манипулируем нашим обучающим набором, оставляя только столбцы (подробности можно увидеть в train_set.ipynb).
Нам нужно только загрузить наш набор данных и использовать этот метод (это так просто).:
new_df = pd.DataFrame(columns=X_train.columns)Имея это в виду, у нас будет этот код для запуска нашего приложения streamlit:
import spacy
import streamlit as st
import joblib
import pandas as pd
from sklearn.feature_extraction.text import TfidfVectorizer
#from sklearn.model_selection import train_test_split
#from sklearn.metrics import accuracy_score, precision_score, recall_score, f1_score

nlp = spacy.load('en_core_web_sm', disable=['parser', 'ner'])
headers = pd.read_csv("headers_only.csv")
rf_model = joblib.load('rf_model.joblib')
vectorizer = TfidfVectorizer(lowercase=False, max_features=10000, ngram_range=(1, 2))

@st.cache_resource
def load_model():
    return joblib.load('rf_model.joblib')

def tokenize_and_lemmatize(text):
  """
  Tokenizes and lemmatizes the input text.

  Args:
      text: A string representing the input text.

  Returns:
      a list of lemmas
  """
  lemmas = []

  doc = nlp(text)

  for token in doc:
      if token.is_alpha and not token.is_stop:
          lemmas.append(token.lemma_)
          new_lemma_tokens = " ".join(lemmas)

  return new_lemma_tokens


def predict_condition(user_input):
  """
  Preprocesses user input, predicts skin condition using the SVM model,
  and returns the prediction result.

  Args:
      user_input: A string representing the user's description.

  Returns:
      A string with the predicted skin condition.
  """
  try:
      # Lowercase and remove punctuation
      user_input = user_input.lower()
      user_input = "".join([char for char in user_input if char.isalnum() or char.isspace()])

      # Tokenize and lemmatize
      lemmatized_text = tokenize_and_lemmatize(user_input)

      # Vectorize the text
      vectorized_input = vectorizer.fit_transform([lemmatized_text])
      vectorized_input = pd.DataFrame(vectorized_input.toarray(), columns=vectorizer.get_feature_names_out())
      vectorized_input = pd.DataFrame(vectorized_input)

      # Load missing columns from training data (if any)
      #missing_columns = set(headers.columns) - set(vectorized_input.columns)
      vectorized_input = vectorized_input.reindex(columns=headers.columns, fill_value=0)
      #vectorized_input = vectorized_input.assign(**{col: 0 for col in missing_columns})

      vectorized_input = vectorized_input[headers.columns]
      st.write(vectorized_input)
      # Predict using the model
      prediction = rf_model.predict(vectorized_input)[0]

      # Return the prediction result
      return prediction

  except Exception as e:
      # Handle potential errors during preprocessing or prediction
      error_message = f"An error occurred: {str(e)}"
      st.error(error_message)
      return None

# Streamlit app layout and functionality
st.title(":blue[Text Sentiment Analyzer] App")
user_input_text = st.text_area("Write your text here:", height=100)

if st.button("Predict"):
    prediction = predict_condition(user_input_text)
    if prediction:
        st.success(f"Predicted condition: {prediction}. \n")
    else:
        st.warning("Prediction failed. Please try again and/or consult with developers.")

# Display model information (optional)
st.header("Model Information")
st.header("This app is powered by a trained Random Forest model.", divider = 'rainbow')

st.write("- Text to be analyzed sentiment-wise")
st.write("- Data Science Club Group One")
st.write("- IG: @american_corner_petropavlovsk")
st.write("- Club host: Askhat Aubakirov")
st.write("- Publication Date: September 17th 2024")Обратите внимание, что есть несколько обработчиков и методов, специфичных для streamlit. Все они приведены в их официальной инструкции: https://docs.streamlit.io/develop/quick-reference/cheat-sheet
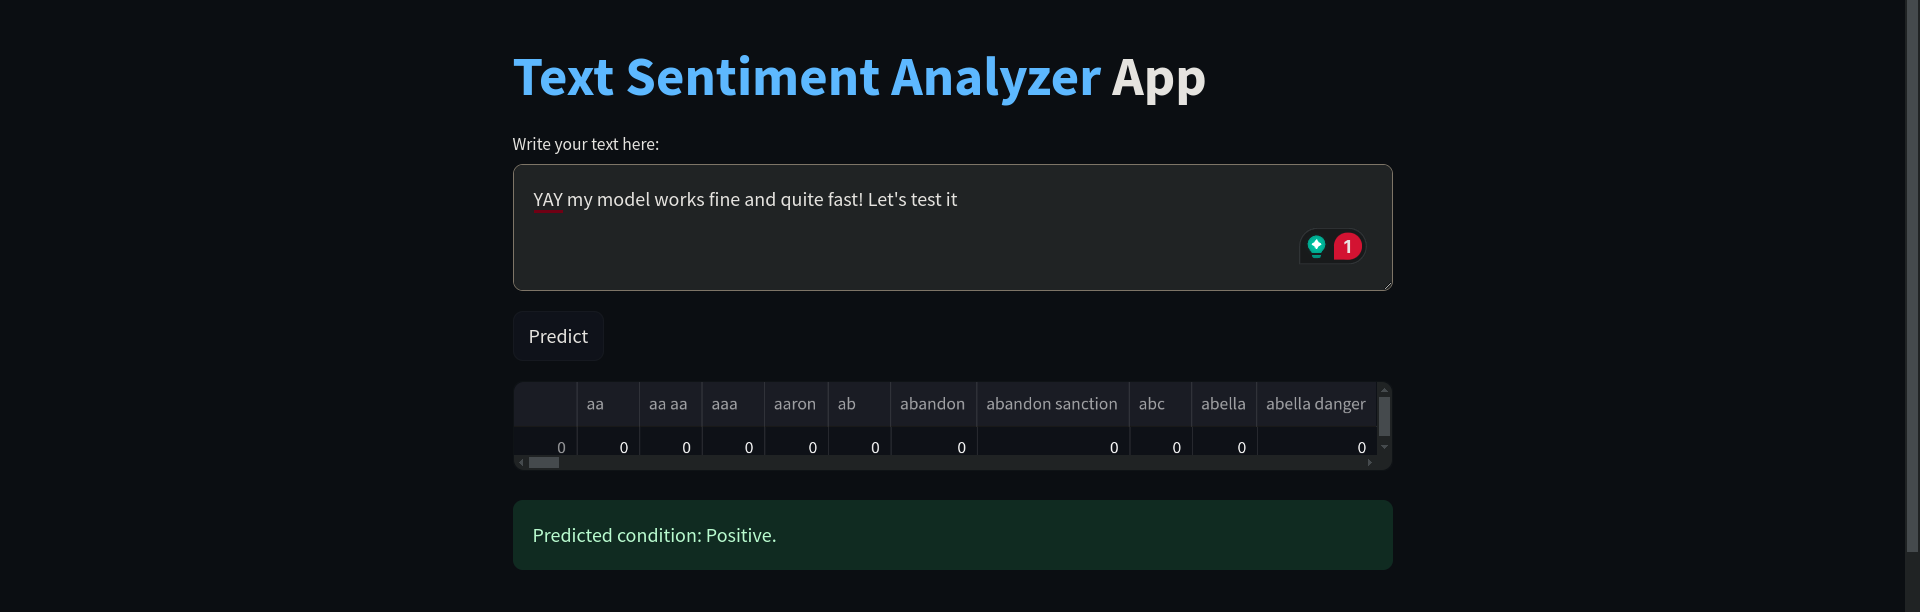
Вот как выглядит продукт:

Спасибо всем участникам Data Science Club в Makerspace Petropavl за активную работу и включение в процесс.
В особенности спасибо тем, кто внес свою лепту в этот код: Арсену и Артуру
Я надеюсь, что эта статья была для вас полезной.
С уважением,
Асхат.
Моя страница в LinkedIn: https://www.linkedin.com/in/askhattio/
Hello there!
My name is Askhat Aubakirov, I recently completed the Data Science Course provided by OUTPEERKZ as part of the TechOrda program.
Today, I am doing data science projects with students of mine at Makerspace Petropavl to share what I know and inspire young people to join the data science world.
Here is what we have created during many of our meetings. Follow us step by step and you'll understand the crucial steps of how data scientists work.
Important: when following this guide, please make sure to install libraries via pip and refer to the files in the github repository (https://github.com/askhat-aubakirov/sentiment/tree/main)
Here is what awaits:
- On the stage of learning: in the Jupyter Notebook:
- Working with Dataset:
--- Data Loading,
--- Exploratory Data Analysis,
--- Data Cleaning,
--- Data Processing,
--- Feature Engineering.
- Preparing for the training:
--- Loading Random Forest Model,
--- Splitting data to train and test arrays.
- Training and testing
- Saving the model - On the stage of Deployment:
- Loading Streamlit
--- Creating a visual template with elements from Streamlit
--- Adapting functions from Jupyter Notebook to tokenize, lemmatize and vectorize user inputs
--- extracting only essential data for deployment
- Launching the app locally and Testing the process with users - Github repo for the project: https://github.com/askhat-aubakirov/sentiment
First, we start with a problem to solve
We will explore NLP (Natural Language Processing) and build a model to classify texts into sentiment categories. In a nutshell, it should be an app to get a text from a user and return one of the verdicts such as "positive", "negative", etc.
The data for this problem is found easily on Kaggle. Here is the link: https://www.kaggle.com/datasets/jp797498e/twitter-entity-sentiment-analysis
Loading necessary libraries:
import pandas as pd                                         #pandas for calculations
import matplotlib.pyplot as plt                             #matplotlib for plotting graphs in EDA steps
import re                                                   #regular expressions library to help us clean up the dataset
import spacy                                                #library for lemmatization function of ours
from sklearn.ensemble import RandomForestClassifier         #machine Learning model we're going to use
from sklearn.metrics import accuracy_score, f1_score        #metrics to measure our success
from sklearn.feature_extraction.text import TfidfVectorizer #method to convert words and text to a matrix
from sklearn.model_selection import train_test_split        #splitting the data to parts
import joblib #library to save the model locally You may see what libraries we have imported so far:
- pandas: used for calculations in matrix algebra (we are going to store and access our dataset as a matrix)
- matplotlib: used to create graphs -> this way we will see if a dataset is imbalanced or too dirty via statistics and visuals
- re: super useful tool for NLP, helps create expressions to recognize complex strings and manipulate them
- spacy: library containing pre-loaded stop words and corpora of the language
- RandomForestClassifier: a model we are going to use. (What is it? Here is some visual explanation: https://youtu.be/cIbj0WuK41w
- metrics: accuracy and F1 score (more details below)
- TfidfVectorizer: great tool to convert words to numerical matrix - the form digestible by an algorithm
- train_test_split: to train a model and calculate metrics, you need a few parts, which are the training set and the test set.
- joblib: a library to save the trained model in one file -> we will use it later in deployment process
Exploratory Data Analysis (EDA)
EDA is a crucial step in data science to understand your data before analysis. It involves:
- Summarizing: Calculating statistics like mean, median, standard deviation.
- Visualizing: Creating plots like histograms, scatter plots, and box plots.
- Cleaning: Handling missing values and outliers.
For a dataset on customer sales:
- Summary: Calculate the average purchase amount, and number of unique customers.
- Visualization: Create a histogram to see the distribution of purchase amounts.
- Cleaning: Handle missing values in customer addresses.
EDA helps you identify patterns, relationships, and potential issues in your data.
First things first, we load the data (saved from Kaggle beforehand):
data = pd.read_csv('twitter_training.csv')Then we go on and take a look at the data using head() method from pandas:
data.head()And in doing so, we get this output:
	2401	Borderlands	Positive	im getting on borderlands and i will murder you all ,
0	2401	Borderlands	Positive	I am coming to the borders and I will kill you...
1	2401	Borderlands	Positive	im getting on borderlands and i will kill you ...
2	2401	Borderlands	Positive	im coming on borderlands and i will murder you...
3	2401	Borderlands	Positive	im getting on borderlands 2 and i will murder ...
4 2401 Borderlands Positive im getting into borderlands and i can murder y...We clearly see it has some IDs (2401, etc.), Entity Names (Borderlands, etc), and Sentiment (Positive, etc. This is a class, in other words). But the thing is we don't have headers here. Let's add them:
data_valid.columns = ['ID', 'entity', 'sentiment', 'content']
data_valid.head(5) ID entity sentiment content
0 352 Amazon Neutral BBC News - Amazon boss Jeff Bezos rejects clai...
1 8312 Microsoft Negative @Microsoft Why do I pay for WORD when it funct...
2 4371 CS-GO Negative CSGO matchmaking is so full of closet hacking,...
3 4433 Google Neutral Now the President is slapping Americans in the...
4 6273 FIFA Negative Hi @EAHelp I’ve had Madeleine McCann in my cel...Now that's better, we have our headers nice and clean.
Graphs
It's high time we generated some charts and looked at the dataset statistically. We will use matplotlib. Read carefully -> code explains itself.
# Get the entity labels from the DataFrame
entity_labels = data['entity']

entity_labels = data["entity"].value_counts() #count the values we have

print(entity_labels)

plt.figure(figsize=(12, 6))
entity_labels.plot(kind='bar')
plt.title('Value Counts of entities')
plt.xlabel('entity')
plt.ylabel('Count')
plt.xticks(fontsize=10) #decrease fontsize for readability - unfortunately, readablity is close to zero
plt.show()

plt.figure(figsize=(4, 4))
entity_labels.plot(kind='box')
plt.title('Value Counts of entities')
plt.xlabel('entity')
plt.ylabel('Count')
plt.xticks(fontsize=10)
plt.show()matplotlib is referred to as plt. We simply call built-in methods to create 2 types of graphs: A bar graph and a box graph. We get this as an output:
entity
TomClancysRainbowSix                 2400
MaddenNFL                            2400
Microsoft                            2400
LeagueOfLegends                      2394
CallOfDuty                           2394
Verizon                              2382
CallOfDutyBlackopsColdWar            2376
ApexLegends                          2376
Facebook                             2370
WorldOfCraft                         2364
Dota2                                2364
NBA2K                                2352
TomClancysGhostRecon                 2346
Battlefield                          2346
FIFA                                 2340
Xbox(Xseries)                        2334
Overwatch                            2334
johnson&johnson                      2328
Amazon                               2316
PlayStation5(PS5)                    2310
HomeDepot                            2310
Cyberpunk2077                        2304
CS-GO                                2304
GrandTheftAuto(GTA)                  2304
...
Fortnite                             2274
RedDeadRedemption(RDR)               2262
AssassinsCreed                       2244
Name: count, dtype: int64The output gives us info on the amounts of entities in the dataset. The dataset is balanced (cause it is curated), so we have "minus one" to the number of data-related problems to solve.
Both plots show almost perfectly balanced data. This means the training process will most likely yield a pretty accurate model. Let's move forward.
Data Preprocessing
We know we have text data. But it is dirty. Tweets we are working with are filled with typos, punctuation, account handlers, URLs and numbers. We define a function to get rid of the unnecessary symbols called clean_tweet.
def clean_tweet(text):
    if isinstance(text, str):
        text = text.lower()  # Convert to lowercase
        text = re.sub(r'http\S+|www\S+|https\S+', '', text, flags=re.MULTILINE)  # Remove URLs
        text = re.sub(r'\@\w+|\#', '', text)  # Remove mentions and hashtags
        text = re.sub(r'[^\w\s]', '', text)  # Remove punctuation
        text = re.sub(r'\d+', '', text)  # Remove numbers
    else:
        text = ''  # Handle non-string inputs like float (NaN) by returning an empty string or handling as needed

return textThe main part here is the re library being used. It is a library of regular expressions.
The regular expression http\S+|www\S+|https\S+ is used to match URLs in text. Here's a breakdown of its components:
- http\S+: Matches the string "http" followed by one or more non-whitespace characters. This captures HTTP URLs.
- www\S+: Matches the string "www" followed by one or more non-whitespace characters. This captures URLs that start with "www".
- https\S+: Matches the string "https" followed by one or more non-whitespace characters. This captures HTTPS URLs.
- The | character is a pipe symbol that acts as an "or" operator, allowing the regular expression to match any of the three patterns.
Now we use the method apply() to use this function to every element of the dataset:
# Apply the cleaning function to the 'content' column
data['clean_content'] = data['content'].apply(clean_tweet)Well done. We have a clean text column in our dataset now:
data.head(5) ID entity sentiment content clean_content
0 2401 Borderlands Positive I am coming to the borders and I will kill you... i am coming to the borders and i will kill you...
1 2401 Borderlands Positive im getting on borderlands and i will kill you ... im getting on borderlands and i will kill you all
2 2401 Borderlands Positive im coming on borderlands and i will murder you... im coming on borderlands and i will murder you...
3 2401 Borderlands Positive im getting on borderlands 2 and i will murder ... im getting on borderlands and i will murder y...
4 2401 Borderlands Positive im getting into borderlands and i can murder y... im getting into borderlands and i can murder y...Tokenization, Lemmatization, Vectorizing
Now the best part in NLP! Take a look at explanations of these three processes:
- Breaking text into smaller units (tokens).
- Example: "The quick brown fox jumps over the lazy dog" becomes ["The", "quick", "brown", "fox", "jumps", "over", "the", "lazy", "dog"].
- Reducing words to their root form (lemma).
- Example: "running", "runs", "ran" are reduced to "run".
- Converting text into numerical representations (vectors).
- Example: Using techniques like Bag-of-Words (BoW) or TF-IDF to represent text as numerical vectors.
And now, the code:
nlp = spacy.load('en_core_web_sm')

def tokenize_and_lemmatize(text):
  """
  Tokenizes and lemmatizes the input text.

  Args:
      text: A string representing the input text.

  Returns:
      a list of lemmas
  """
  lemmas = []

  doc = nlp(text)

  for token in doc:
      if token.is_alpha and not token.is_stop:
          lemmas.append(token.lemma_)

  new_lemma_tokens = " ".join(lemmas) #Arsen was right -> I had indentation error

return new_lemma_tokensdata['lemmas'] = data['clean_content'].apply(tokenize_and_lemmatize)And when we take a look at the dataset now, we see something like this:
        ID	entity	    sentiment	content	                                                clean_content	                                        lemmas
0	352	Amazon	    Neutral	BBC News - Amazon boss Jeff Bezos rejects clai...	bbc news amazon boss jeff bezos rejects claim...	bbc news amazon boss jeff bezos rejects claim ...
1	8312	Microsoft   Negative	@Microsoft Why do I pay for WORD when it funct...	why do i pay for word when it functions so po...	pay word function poorly chromebook
2	4371	CS-GO	    Negative	CSGO matchmaking is so full of closet hacking,...	csgo matchmaking is so full of closet hacking ...	csgo matchmaking closet hack truly awful game
3	4433	Google	    Neutral	Now the President is slapping Americans in the...	now the president is slapping americans in the...	president slap americans face commit unlawful ...
4 6273 FIFA Negative Hi @EAHelp I’ve had Madeleine McCann in my cel... hi ive had madeleine mccann in my cellar for ... hi ve madeleine mccann cellar past year little... Let's take a look at what differences to the text we've made so far:
original text "@Microsoft Why do I pay for WORD when it funct..." became "why do i pay for word when it functions so po..." and then became "pay word function poorly chromebook".
The trick is the meaning of the tweet is clear when you read just lemmas, not every single word.
And now, Vectorizing. It's conversion to numbers. We need to feed the model matrices with numbers, not words. We will use TF-IDF Vectorizer for this task:
It works like this:
1) We get tokens(words, terms) x and calculate how many times it is present in the document y, then we calculate the frequency of term x in this document y -> this is TF_x,y
2) We multiply the TF_x,y with IDF (which is logarithm of the total amount of documents divided by the amount of documents that contain the term x.
This gives us a great representation of the importance of the word. For example, we may have many words like "I", "have", "we", etc. Although there are many of them, they are not very important. On the other hand, we may have just few mentions of words like "happy", "angry" or anything like these, but they are important.
So, TF-IDF Vectorizer gives relative coefficients of frequency (any float from 0 to 1), by which we may estimate the importance of the terms.
Here is what it looks like in code:
#vectorizing the lemmatized text -> this is basically Feature Engineering, cause we have text data and define max_features
vectorizer = TfidfVectorizer(lowercase=False, max_features=10000, ngram_range=(1, 2))
vectorized_data = vectorizer.fit_transform(data['lemmas'].values.astype('U'))
vectorized_data = pd.DataFrame(vectorized_data.toarray(), columns=vectorizer.get_feature_names_out()) EXPLANATION:
vectorizer = TfidfVectorizer(lowercase=False, max_features=10000, ngram_range=(1, 2)) creates a vectorizer with parameters like lowercase=False, because applied lowercase before, max_features=10000 to determine the amount of new features' columns, and ngram_range=(1, 2) to make features consist not only of single words but combinations of two words.
That's quite handy, since in, for example, medical data cases words like "heart" and "attack" may have separate meanings, but "heart attack" has more important meaning.
Now the dataset we have looks like this and has the shape of 74681 x 10000:
aa	aa aa	aaa	aaron	ab	abandon	abandon sanction	abc	abella	abella danger	...	zero dawn	zion	zip	zoe	zombie	zone	zonestreamcx	zoom	zsmitty	zuckerberg
0	0.0	0.0	0.0	0.0	0.0	0.0	0.0	0.0	0.0	0.0	...	0.0	0.0	0.0	0.0	0.0	0.0	0.0	0.0	0.0	0.0
1	0.0	0.0	0.0	0.0	0.0	0.0	0.0	0.0	0.0	0.0	...	0.0	0.0	0.0	0.0	0.0	0.0	0.0	0.0	0.0	0.0
2	0.0	0.0	0.0	0.0	0.0	0.0	0.0	0.0	0.0	0.0	...	0.0	0.0	0.0	0.0	0.0	0.0	0.0	0.0	0.0	0.0
3	0.0	0.0	0.0	0.0	0.0	0.0	0.0	0.0	0.0	0.0	...	0.0	0.0	0.0	0.0	0.0	0.0	0.0	0.0	0.0	0.0
4	0.0	0.0	0.0	0.0	0.0	0.0	0.0	0.0	0.0	0.0	...	0.0	0.0	0.0	0.0	0.0	0.0	0.0	0.0	0.0	0.0
5	0.0	0.0	0.0	0.0	0.0	0.0	0.0	0.0	0.0	0.0	...	0.0	0.0	0.0	0.0	0.0	0.0	0.0	0.0	0.0	0.0
6	0.0	0.0	0.0	0.0	0.0	0.0	0.0	0.0	0.0	0.0	...	0.0	0.0	0.0	0.0	0.0	0.0	0.0	0.0	0.0	0.0
7	0.0	0.0	0.0	0.0	0.0	0.0	0.0	0.0	0.0	0.0	...	0.0	0.0	0.0	0.0	0.0	0.0	0.0	0.0	0.0	0.0
8	0.0	0.0	0.0	0.0	0.0	0.0	0.0	0.0	0.0	0.0	...	0.0	0.0	0.0	0.0	0.0	0.0	0.0	0.0	0.0	0.0
9 0.0 0.0 0.0 0.0 0.0 0.0 0.0 0.0 0.0 0.0 ... 0.0 0.0 0.0 0.0 0.0 0.0 0.0 0.0 0.0 0.0Note it has 10 000 words and combinations of words, each with their own frequency across documents. Now that IS a matrix we may feed to the model.
Model Choice and Training
We should split the dataset in order to train it and then test it to get our metrics.
For now, we are at the left part of the scheme. We have our features matrix and our classes. We need to split it to X_train, y_train (training matrix, or "questions", and target classes, or "answers"). Plus, X_test and y_test. We need that to test how good (or bad) our model performs.
X_train, X_test, y_train, y_test = train_test_split(vectorized_data, data['sentiment'], test_size=0.2, random_state=42)Model we will work with is Random Forest Classifier.
- Bootstrap Sampling: Random sampling with replacement: Multiple subsets (bootstrap samples) are created from the original dataset. Each subset may contain duplicate instances.
- Random sampling with replacement: Multiple subsets (bootstrap samples) are created from the original dataset. Each subset may contain duplicate instances.
- Decision Tree Building: Random feature selection: For each tree, a random subset of features is selected from the total number of features.Decision tree growth:Each decision tree is grown to its maximum depth without pruning.
- Random feature selection: For each tree, a random subset of features is selected from the total number of features.
- Decision tree growth:Each decision tree is grown to its maximum depth without pruning.
- Prediction: Voting: To make a prediction for a new instance, each decision tree casts a vote. The class with the most votes is chosen as the final prediction.
- Voting: To make a prediction for a new instance, each decision tree casts a vote. The class with the most votes is chosen as the final prediction.
rf = RandomForestClassifier(n_estimators=100, random_state=42)

rf.fit(X_train, y_train)n_estimators in a Random Forest classifier refers to the number of decision trees that are grown in the ensemble. random_state=42 is something of a seed -> used to ensure reproducibility. Also, it is a reference to the book "The Hitchhikers Guide to the Galaxy", where civilization asked what the meaning of life was and got "42" as an answer from the biggest computer in the galaxy. It's quite fun, isn't it?
When Random Forest Model finishes the training (took 11 minutes for me), it'll show this:
Now let's test it. We make predictions on our X_test set, getting y_pred as output and then compare results to the y_test via metrics such as Accuracy and F1 Score.
Here is the explanation of what these metrics are (along with other metrics as well):
And now, the code and output:
y_pred = rf.predict(X_test)

accuracy = accuracy_score(y_test, y_pred)
f1 = f1_score(y_test, y_pred, average='macro')

print("Accuracy:", accuracy)
print("F1 score:", f1)Accuracy: 0.8594764678315592
F1 score: 0.8567240271159241We may say our model has accuracy of 86.95% and F1 score of 85.67%
Let us now test the model on our "organic" sample.
Just give the model some text out of our heads as an input, but don't forget to preprocess it (cleaning, tokenization, lemmatization, vectorizing + compare and modify format -> columns of the input matrix has to be the same as columns of the train matrix).
Here is the code for this:
nlp = spacy.load('en_core_web_sm', disable=['parser', 'ner'])
headers = pd.read_csv("headers_only.csv")
rf_model = joblib.load('rf_model.joblib')
vectorizer = TfidfVectorizer(lowercase=False, max_features=10000, ngram_range=(1, 2))

def tokenize_and_lemmatize(text):
  """
  Tokenizes and lemmatizes the input text.

  Args:
      text: A string representing the input text.

  Returns:
      a list of lemmas
  """
  lemmas = []

  doc = nlp(text)

  for token in doc:
      if token.is_alpha and not token.is_stop:
          lemmas.append(token.lemma_)
          new_lemma_tokens = " ".join(lemmas)

  return new_lemma_tokens

def predict_condition(user_input):
  """
  Preprocesses user input, predicts skin condition using the SVM model,
  and returns the prediction result.

  Args:
      user_input: A string representing the user's description.

  Returns:
      A string with the predicted skin condition.
  """
  try:
      # Lowercase and remove punctuation
      #user_input = user_input.lower()
      #user_input = "".join([char for char in user_input if char.isalnum() or char.isspace()])

      # Tokenize and lemmatize
      # lemmatized_text = tokenize_and_lemmatize(user_input)

      # Vectorize the text
      vectorized_input = vectorizer.fit_transform([user_input])
      vectorized_input = pd.DataFrame(vectorized_input.toarray(), columns=vectorizer.get_feature_names_out())
      #vectorized_input = pd.DataFrame(vectorized_input)

      # Load missing columns from training data (if any)
      missing_columns = set(headers.columns) - set(vectorized_input.columns)
      vectorized_input = vectorized_input.reindex(columns=headers.columns, fill_value=0)

      vectorized_input = vectorized_input[headers.columns]

      # Predict using the model
      prediction = rf_model.predict(vectorized_input)[0]

      # Return the prediction result
      return prediction

  except Exception as e:
      # Handle potential errors during preprocessing or prediction
      error_message = f"An error occurred: {str(e)}"
      return None

user_input = "YAY my model works fine and quite fast! Let's test it"
user_input = user_input.lower()

prediction = predict_condition(user_input)
print(prediction) Note these lines:
- missing_columns = set(headers.columns) - set(vectorized_input.columns)
- vectorized_input = vectorized_input.reindex(columns=headers.columns, fill_value=0)
They are here to make sure the columns of the train set are the same as the columns of the input. It is a simple representation of a mechanism pretty much the same as when a person recognizes only words they know from a speech. For the words our model doesn't know, it'll simply put zeroes, which is equivalent to us ignoring something we don't know about a word or few in someone's speech.
So, the output for the "YAY my model works fine and quite fast! Let's test it" is Positive
PositiveDeployment using Streamlit
Now, let's make it an app. Streamlit is a simple library to use specially for Data Scientists, since it takes care of all UI rendering.
Remember, for the streamlit app, you need to make user input go through all of the steps of text preprocessing as the input above. But the thing is we uploaded our whole train set for the training in the Jupyter Notebook, which we don't need here, since the dataset is very big. We only need headers, so we manipulate our training set to only leave columns (details can bee seen in the train_set.ipynb).
We only need to load our dataset and use this method (it's that simple):
new_df = pd.DataFrame(columns=X_train.columns)With this in mind, we will have this code to run our streamlit app:
import spacy
import streamlit as st
import joblib
import pandas as pd
from sklearn.feature_extraction.text import TfidfVectorizer
#from sklearn.model_selection import train_test_split
#from sklearn.metrics import accuracy_score, precision_score, recall_score, f1_score

nlp = spacy.load('en_core_web_sm', disable=['parser', 'ner'])
headers = pd.read_csv("headers_only.csv")
rf_model = joblib.load('rf_model.joblib')
vectorizer = TfidfVectorizer(lowercase=False, max_features=10000, ngram_range=(1, 2))

@st.cache_resource
def load_model():
    return joblib.load('rf_model.joblib')

def tokenize_and_lemmatize(text):
  """
  Tokenizes and lemmatizes the input text.

  Args:
      text: A string representing the input text.

  Returns:
      a list of lemmas
  """
  lemmas = []

  doc = nlp(text)

  for token in doc:
      if token.is_alpha and not token.is_stop:
          lemmas.append(token.lemma_)
          new_lemma_tokens = " ".join(lemmas)

  return new_lemma_tokens


def predict_condition(user_input):
  """
  Preprocesses user input, predicts skin condition using the SVM model,
  and returns the prediction result.

  Args:
      user_input: A string representing the user's description.

  Returns:
      A string with the predicted skin condition.
  """
  try:
      # Lowercase and remove punctuation
      user_input = user_input.lower()
      user_input = "".join([char for char in user_input if char.isalnum() or char.isspace()])

      # Tokenize and lemmatize
      lemmatized_text = tokenize_and_lemmatize(user_input)

      # Vectorize the text
      vectorized_input = vectorizer.fit_transform([lemmatized_text])
      vectorized_input = pd.DataFrame(vectorized_input.toarray(), columns=vectorizer.get_feature_names_out())
      vectorized_input = pd.DataFrame(vectorized_input)

      # Load missing columns from training data (if any)
      #missing_columns = set(headers.columns) - set(vectorized_input.columns)
      vectorized_input = vectorized_input.reindex(columns=headers.columns, fill_value=0)
      #vectorized_input = vectorized_input.assign(**{col: 0 for col in missing_columns})

      vectorized_input = vectorized_input[headers.columns]
      st.write(vectorized_input)
      # Predict using the model
      prediction = rf_model.predict(vectorized_input)[0]

      # Return the prediction result
      return prediction

  except Exception as e:
      # Handle potential errors during preprocessing or prediction
      error_message = f"An error occurred: {str(e)}"
      st.error(error_message)
      return None

# Streamlit app layout and functionality
st.title(":blue[Text Sentiment Analyzer] App")
user_input_text = st.text_area("Write your text here:", height=100)

if st.button("Predict"):
    prediction = predict_condition(user_input_text)
    if prediction:
        st.success(f"Predicted condition: {prediction}. \n")
    else:
        st.warning("Prediction failed. Please try again and/or consult with developers.")

# Display model information (optional)
st.header("Model Information")
st.header("This app is powered by a trained Random Forest model.", divider = 'rainbow')

st.write("- Text to be analyzed sentiment-wise")
st.write("- Data Science Club Group One")
st.write("- IG: @american_corner_petropavlovsk")
st.write("- Club host: Askhat Aubakirov")
st.write("- Publication Date: September 17th 2024")Notice there are some handlers and streamlit-specific methods. All of them can be found on their official cheat sheet: https://docs.streamlit.io/develop/quick-reference/cheat-sheet
Here is what the product looks like:
THE END
Big thanks to all of the participants of Data Club at Makerspace Petropavl for all the great work you do. Special thanks to those who added their ideas to this code: Arsen and Arthur.
I hope you found this article helpful.
Best regards,
Askhat.
My LinkedIn: https://www.linkedin.com/in/askhattio/

 Поделиться