


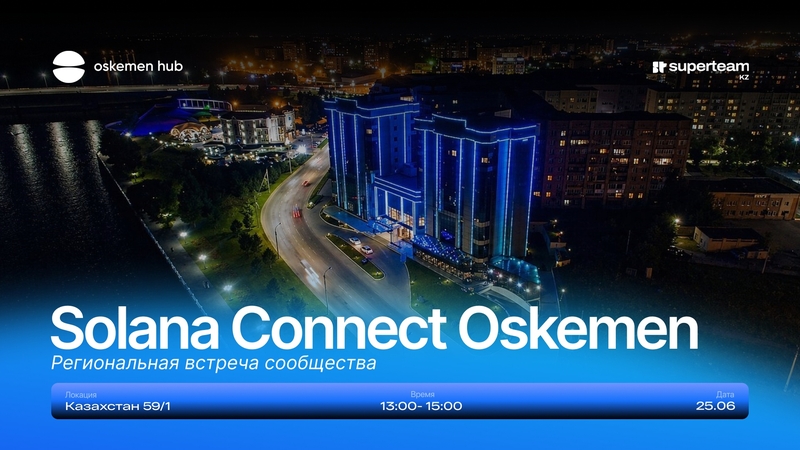
Solana Connect Oskemen
On June 25, Oskemen Hub will host the Solana Connect Oskemen 🟣 meetup
Solana Connect brings cities and regions together through real-life gatherings. This is not about boring lectures — it’s about people, atmosphere, new connections, and the chance to spend time together while exploring something new in the world of technology, AI, and Web3.
The format is simple and friendly:
🍕 we’ll eat pizza
🤝 get to know each other
💬 talk about ideas, projects, and opportunities
🎲 play the board game “Bunker”
🛍 each participant will receive a branded tote bag
We will select only 12 participants to keep the event intimate and ensure a comfortable, relaxed vibe for conversation.
Registration via Luma is required.
Without registration through the link, participation will not be allowed.
📅 Date: June 25, 2026
⏰ Time: 13:00–15:00
📍 Location: Oskemen Hub


 Share
Share